
- Start >
- Rivers >
- Waterlevel >
- Iller - Lech - Bodensee >
- Eschach >
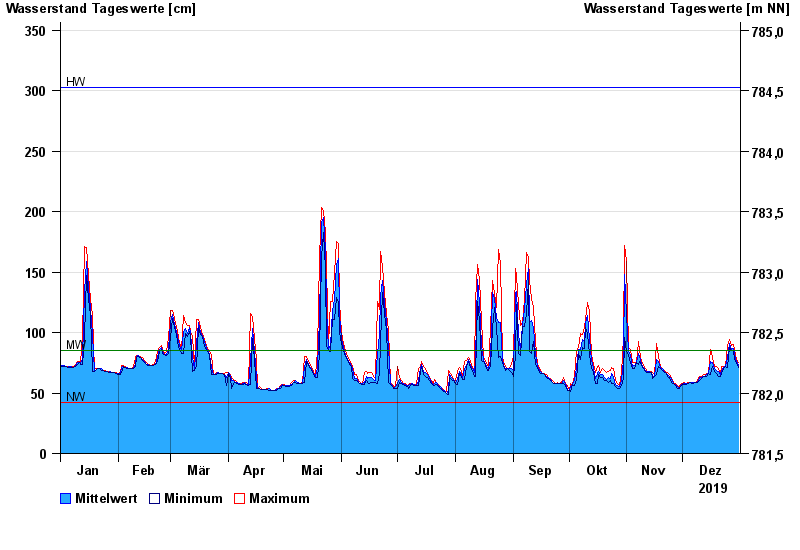
- Chart of year

Chart of year Eschach / Füssener Achen
Waterlevel from 01.01.2019 to 31.12.2019
| Date | Mean value [cm] | Maximum [cm] | Minimum [cm] |
|---|---|---|---|
| 31.12.2019 | 73 | 75 | 71 |
| 30.12.2019 | 76 | 78 | 75 |
| 29.12.2019 | 82 | 86 | 78 |
| 28.12.2019 | 87 | 90 | 85 |
| 27.12.2019 | 86 | 89 | 85 |
| 26.12.2019 | 91 | 94 | 88 |
| 25.12.2019 | 79 | 89 | 71 |
© Bayerisches Landesamt für Umwelt 2025