
- Start >
- Rivers >
- Waterlevel >
- Iller - Lech - Bodensee >
- Füssen >
- Chart of month

Chart of month Füssen / Lech
Waterlevel from 01.08.2022 to 31.08.2022
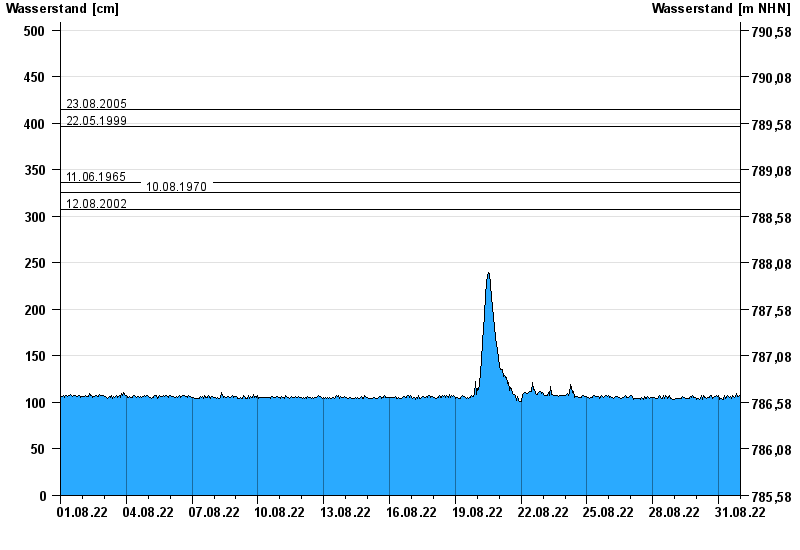
- 23.08.2005 Wasserstand: 415 cm
- 22.05.1999 Wasserstand: 397 cm
- 11.06.1965 Wasserstand: 337 cm
- 10.08.1970 Wasserstand: 326 cm
- 12.08.2002 Wasserstand: 308 cm
| Date | Waterlevel [cm] |
|---|---|
| 01.09.2022 00:45 | 105 |
| 01.09.2022 00:30 | 104 |
| 01.09.2022 00:15 | 103 |
| 01.09.2022 00:00 | 102 |
| 31.08.2022 23:45 | 100 |
| 31.08.2022 23:30 | 105 |
| 31.08.2022 23:15 | 108 |
© Bayerisches Landesamt für Umwelt 2024