
- Start >
- Rivers >
- Waterlevel >
- Iller - Lech - Bodensee >
- Görisried >
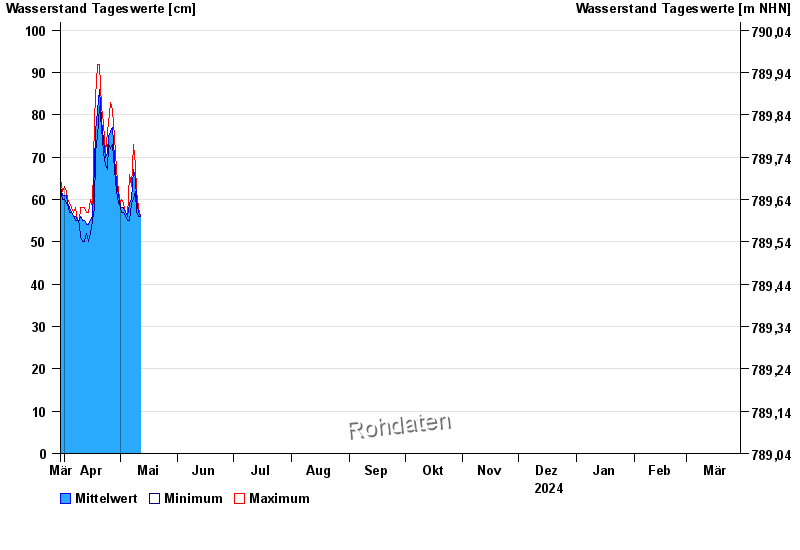
- Chart of year

Chart of year Görisried / Waldbach
Waterlevel from 30.03.2024 to 29.03.2025
| Date | Mean value [cm] | Maximum [cm] | Minimum [cm] |
|---|---|---|---|
| 17.07.2024 | 55 | 56 | 54 |
| 16.07.2024 | 57 | 58 | 56 |
| 15.07.2024 | 58 | 61 | 56 |
| 14.07.2024 | 67 | 74 | 61 |
| 13.07.2024 | 93 | 135 | 74 |
| 12.07.2024 | 70 | 171 | 51 |
| 11.07.2024 | 52 | 52 | 51 |
© Bayerisches Landesamt für Umwelt 2024