
- Start >
- Rivers >
- Waterlevel >
- Iller - Lech - Bodensee >
- Landsberg >
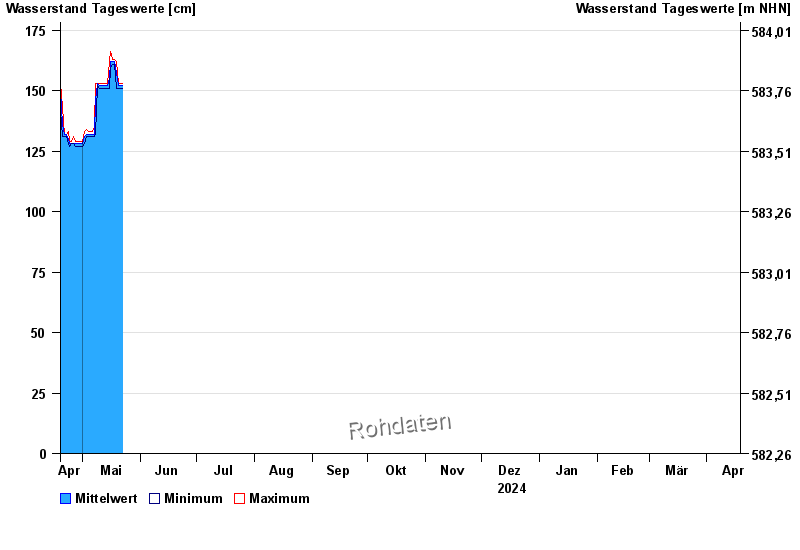
- Chart of year

Chart of year Landsberg / Lech
Waterlevel from 19.04.2024 to 18.04.2025
note
Messwerte beeinflusst durch Kraftwerkssteuerungen.
| Date | Mean value [cm] | Maximum [cm] | Minimum [cm] |
|---|---|---|---|
| 15.10.2024 | 163 | 164 | 162 |
| 14.10.2024 | 159 | 167 | 153 |
| 13.10.2024 | 164 | 180 | 154 |
| 12.10.2024 | 170 | 176 | 167 |
| 11.10.2024 | 164 | 166 | 163 |
| 10.10.2024 | 163 | 170 | 162 |
| 09.10.2024 | 163 | 164 | 162 |
© Bayerisches Landesamt für Umwelt 2024