
- Start >
- Rivers >
- Waterlevel >
- Iller - Lech - Bodensee >
- Leuterschach >
- Chart of year

Chart of year Leuterschach / Lobach
Waterlevel from 22.01.2020 to 21.01.2021
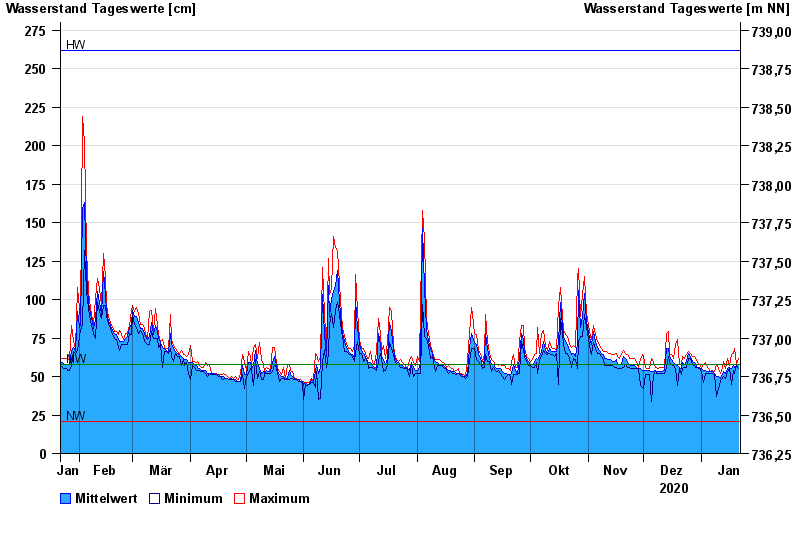
| Date | Mean value [cm] | Maximum [cm] | Minimum [cm] |
|---|---|---|---|
| 21.01.2021 | 58 | 62 | 55 |
| 20.01.2021 | 57 | 58 | 57 |
| 19.01.2021 | 56 | 68 | 52 |
| 18.01.2021 | 57 | 65 | 54 |
| 17.01.2021 | 55 | 64 | 45 |
| 16.01.2021 | 56 | 57 | 55 |
| 15.01.2021 | 55 | 62 | 53 |
© Bayerisches Landesamt für Umwelt 2024