
- Start >
- Rivers >
- Waterlevel >
- Iller - Lech - Bodensee >
- Oberstaufen >
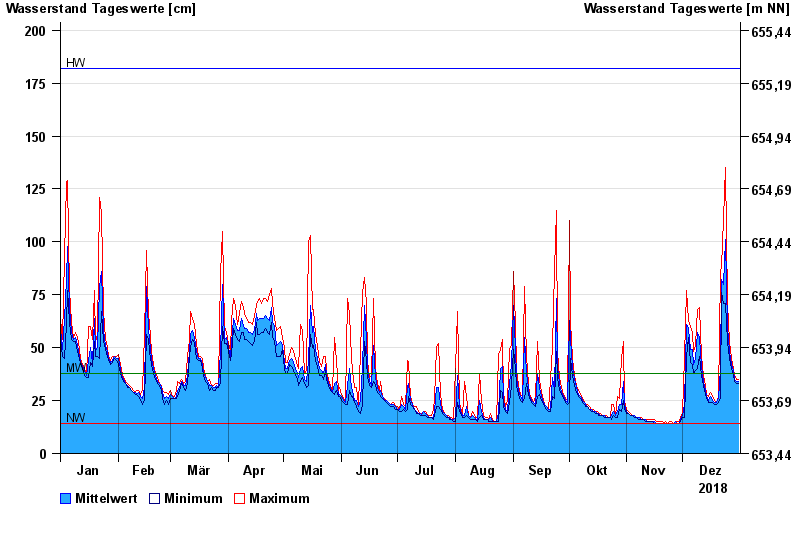
- Chart of year

Chart of year Oberstaufen / Weißach
Waterlevel from 01.01.2018 to 31.12.2018
| Date | Mean value [cm] | Maximum [cm] | Minimum [cm] |
|---|---|---|---|
| 31.12.2018 | 34 | 35 | 33 |
| 30.12.2018 | 34 | 35 | 33 |
| 29.12.2018 | 35 | 37 | 34 |
| 28.12.2018 | 39 | 40 | 37 |
| 27.12.2018 | 42 | 45 | 40 |
| 26.12.2018 | 48 | 53 | 45 |
| 25.12.2018 | 60 | 71 | 53 |
© Bayerisches Landesamt für Umwelt 2024