
- Start >
- Rivers >
- Waterlevel >
- Iller - Lech - Bodensee >
- Pfronten Ried >
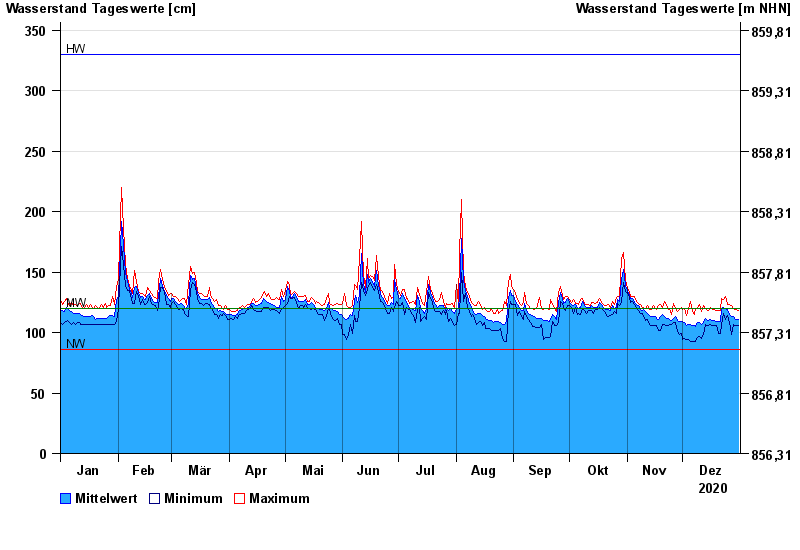
- Chart of year

Chart of year Pfronten Ried / Vils
Waterlevel from 01.01.2020 to 31.12.2020
| Date | Mean value [cm] | Maximum [cm] | Minimum [cm] |
|---|---|---|---|
| 31.12.2020 | 111 | 118 | 106 |
| 30.12.2020 | 111 | 119 | 106 |
| 29.12.2020 | 112 | 119 | 106 |
| 28.12.2020 | 113 | 120 | 107 |
| 27.12.2020 | 113 | 122 | 98 |
| 26.12.2020 | 115 | 123 | 108 |
| 25.12.2020 | 119 | 123 | 114 |
© Bayerisches Landesamt für Umwelt 2025