
- Start >
- Rivers >
- Waterlevel >
- Iller - Lech - Bodensee >
- Remshart >
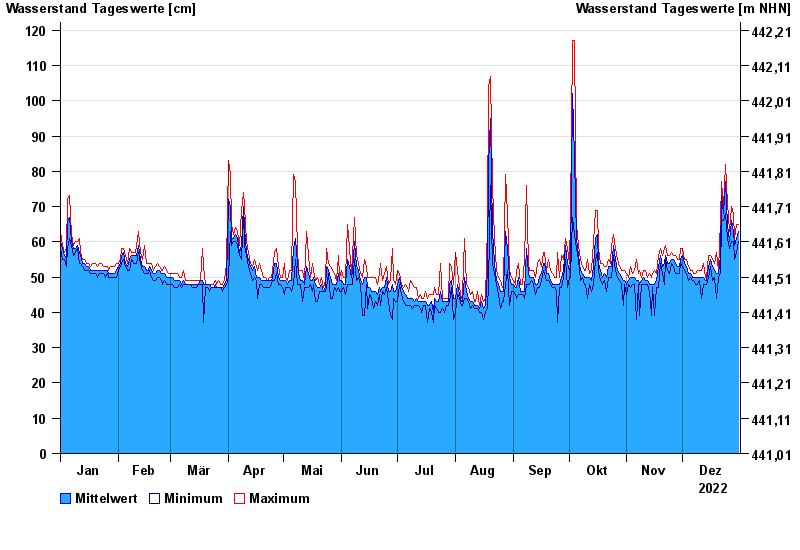
- Chart of year

Chart of year Remshart / Kammel
Waterlevel from 01.01.2022 to 31.12.2022
- Hochwassergefahrenfläche HQ100 240 cm
| Date | Mean value [cm] | Maximum [cm] | Minimum [cm] |
|---|---|---|---|
| 31.12.2022 | 63 | 65 | 60 |
| 30.12.2022 | 61 | 65 | 57 |
| 29.12.2022 | 59 | 61 | 55 |
| 28.12.2022 | 63 | 68 | 60 |
| 27.12.2022 | 66 | 70 | 60 |
| 26.12.2022 | 60 | 63 | 58 |
| 25.12.2022 | 65 | 71 | 61 |
© Bayerisches Landesamt für Umwelt 2025