
- Start >
- Rivers >
- Waterlevel >
- Iller - Lech - Bodensee >
- Rosenheim o.d. Mangfallmündung >
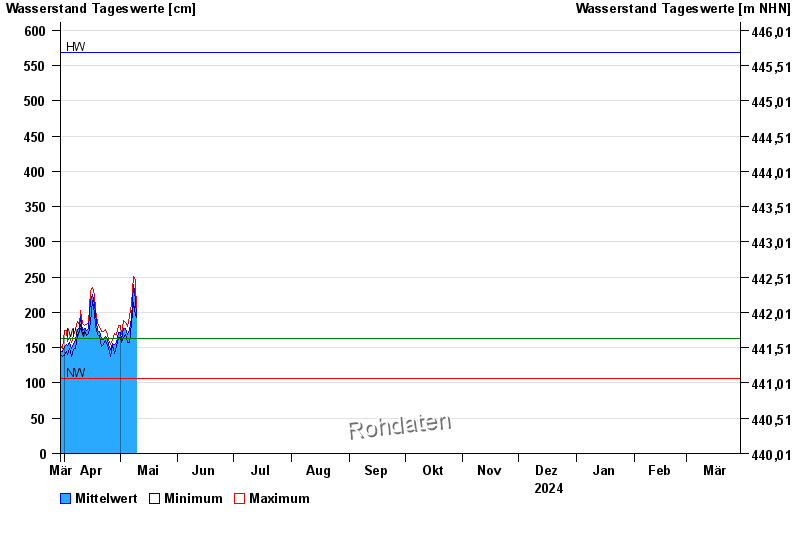
- Chart of year

Chart of year Rosenheim o.d. Mangfallmündung / Inn
Waterlevel from 30.03.2024 to 29.03.2025
| Date | Mean value [cm] | Maximum [cm] | Minimum [cm] |
|---|---|---|---|
| 11.08.2024 | 210 | 221 | 193 |
| 10.08.2024 | 211 | 220 | 200 |
| 09.08.2024 | 227 | 247 | 205 |
| 08.08.2024 | 259 | 269 | 241 |
| 07.08.2024 | 245 | 257 | 233 |
| 06.08.2024 | 245 | 254 | 237 |
| 05.08.2024 | 244 | 255 | 234 |
© Bayerisches Landesamt für Umwelt 2024