
- Start >
- Rivers >
- Waterlevel >
- Iller - Lech - Bodensee >
- Seltmans >
- Chart of year

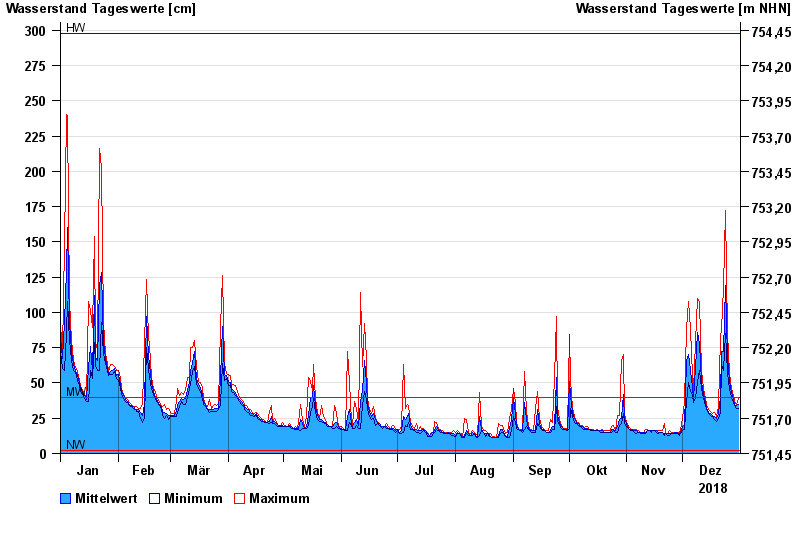
Chart of year Seltmans / Untere Argen
Waterlevel from 01.01.2018 to 31.12.2018
| Date | Mean value [cm] | Maximum [cm] | Minimum [cm] |
|---|---|---|---|
| 31.12.2018 | 35 | 39 | 32 |
| 30.12.2018 | 34 | 35 | 32 |
| 29.12.2018 | 35 | 37 | 34 |
| 28.12.2018 | 38 | 41 | 36 |
| 27.12.2018 | 43 | 46 | 40 |
| 26.12.2018 | 51 | 57 | 46 |
| 25.12.2018 | 68 | 85 | 57 |
© Bayerisches Landesamt für Umwelt 2024