
- Start >
- Rivers >
- Waterlevel >
- Iller - Lech - Bodensee >
- Türkheim >
- Chart of year

Chart of year Türkheim / Wertach
Waterlevel from 01.01.2016 to 31.12.2016
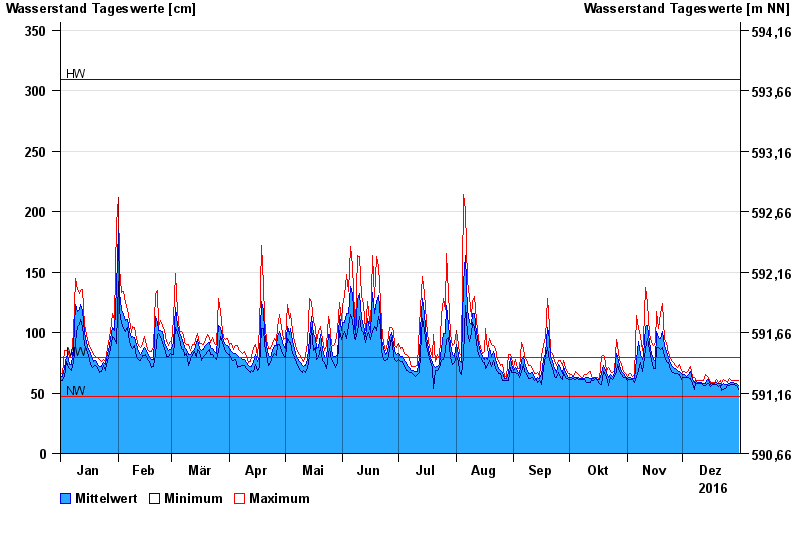
note
Beeinflussung durch Kraftwerksbetrieb
| Date | Mean value [cm] | Maximum [cm] | Minimum [cm] |
|---|---|---|---|
| 31.12.2016 | 56 | 60 | 53 |
| 30.12.2016 | 58 | 60 | 56 |
| 29.12.2016 | 58 | 60 | 57 |
| 28.12.2016 | 59 | 60 | 57 |
| 27.12.2016 | 59 | 60 | 57 |
| 26.12.2016 | 58 | 62 | 56 |
| 25.12.2016 | 57 | 59 | 56 |
© Bayerisches Landesamt für Umwelt 2025