
- Start >
- Rivers >
- Waterlevel >
- Inn >
- Bad Tölz >
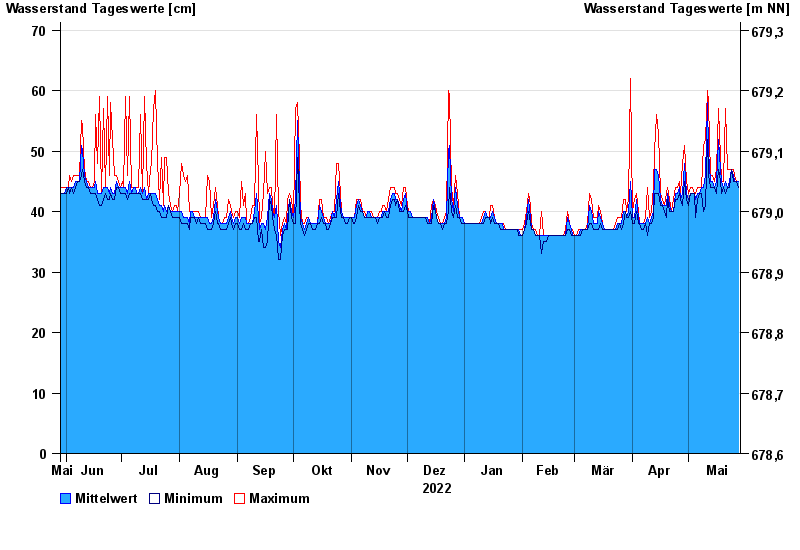
- Chart of year

Chart of year Bad Tölz / Ellbach
Waterlevel from 29.05.2022 to 28.05.2023
- 22.05.1999 Wasserstand: 124 cm
- 23.07.1966 Wasserstand: 117 cm
- 10.09.2010 Wasserstand: 113 cm
- 18.06.1979 Wasserstand: 108 cm
- 02.06.2013 Wasserstand: 107 cm
| Date | Mean value [cm] | Maximum [cm] | Minimum [cm] |
|---|---|---|---|
| 28.05.2023 | 45 | 45 | 44 |
| 27.05.2023 | 45 | 45 | 45 |
| 26.05.2023 | 45 | 46 | 45 |
| 25.05.2023 | 46 | 47 | 45 |
| 24.05.2023 | 47 | 47 | 47 |
| 23.05.2023 | 45 | 47 | 44 |
| 22.05.2023 | 44 | 47 | 44 |
© Bayerisches Landesamt für Umwelt 2024