
- Start >
- Rivers >
- Waterlevel >
- Inn >
- Burghausen >
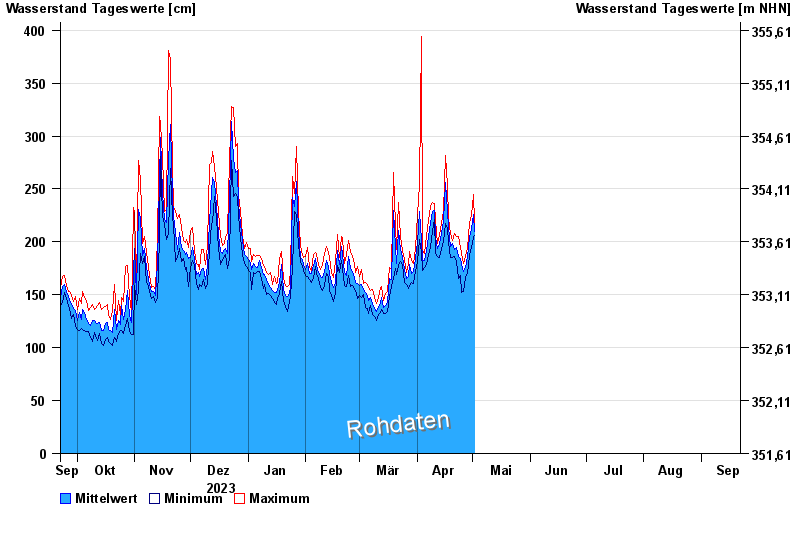
- Chart of year

Chart of year Burghausen / Salzach
Waterlevel from 22.09.2023 to 21.09.2024
- 14.09.1899 Wasserstand: 928 cm
- 08.09.1920 Wasserstand: 910 cm
- 03.06.2013 Wasserstand: 894 cm
- 14.08.1959 Wasserstand: 814 cm
- 13.08.2002 Wasserstand: 810 cm
| Date | Mean value [cm] | Maximum [cm] | Minimum [cm] |
|---|---|---|---|
| 21.09.2024 | 312 | 326 | 290 |
| 20.09.2024 | 324 | 342 | 304 |
| 19.09.2024 | 341 | 356 | 309 |
| 18.09.2024 | 362 | 412 | 316 |
| 17.09.2024 | 468 | 512 | 408 |
| 16.09.2024 | 394 | 454 | 369 |
| 15.09.2024 | 467 | 504 | 417 |
© Bayerisches Landesamt für Umwelt 2024