
- Start >
- Rivers >
- Waterlevel >
- Inn >
- Burghausen >
- Chart of year

Chart of year Burghausen / Salzach
Waterlevel from 01.01.2020 to 31.12.2020
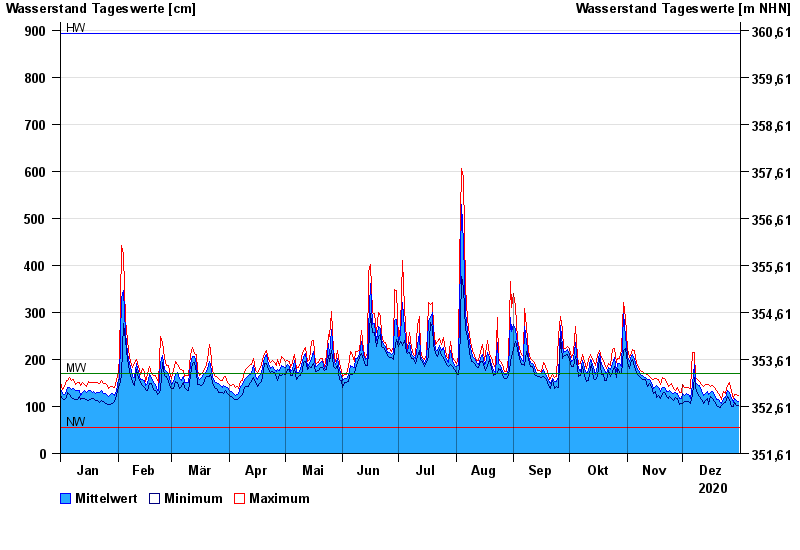
| Date | Mean value [cm] | Maximum [cm] | Minimum [cm] |
|---|---|---|---|
| 31.12.2020 | 110 | 123 | 102 |
| 30.12.2020 | 112 | 126 | 103 |
| 29.12.2020 | 116 | 126 | 108 |
| 28.12.2020 | 109 | 117 | 99 |
| 27.12.2020 | 116 | 131 | 100 |
| 26.12.2020 | 130 | 151 | 115 |
| 25.12.2020 | 134 | 145 | 122 |
© Bayerisches Landesamt für Umwelt 2025