
- Start >
- Rivers >
- Waterlevel >
- Inn >
- Erlachleiten >
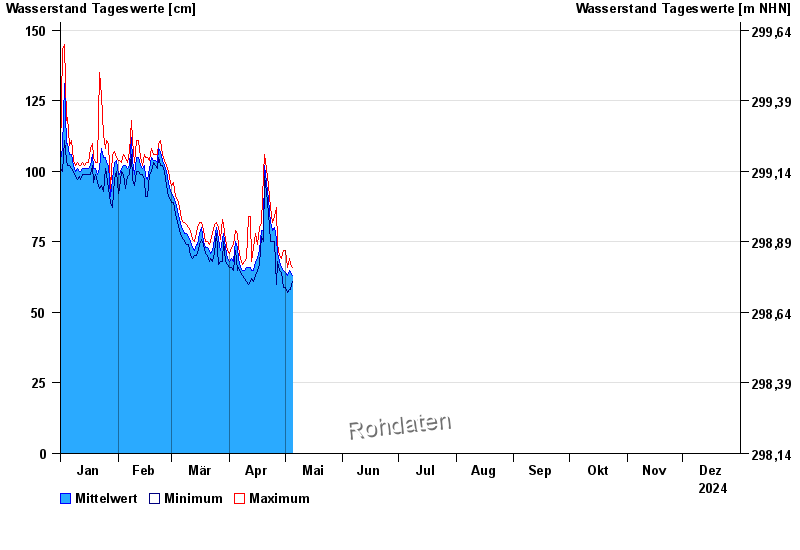
- Chart of year

Chart of year Erlachleiten / Erlau
Waterlevel from 01.01.2024 to 31.12.2024
- 25.06.2016 Wasserstand: 251 cm
- 16.03.2019 Wasserstand: 204 cm
- 20.06.2012 Wasserstand: 204 cm
- 06.07.2009 Wasserstand: 179 cm
- 14.01.2011 Wasserstand: 175 cm
| Date | Mean value [cm] | Maximum [cm] | Minimum [cm] |
|---|---|---|---|
| 13.07.2024 | 67 | 71 | 63 |
| 12.07.2024 | 63 | 69 | 56 |
| 11.07.2024 | 70 | 82 | 60 |
| 10.07.2024 | 69 | 96 | 62 |
| 09.07.2024 | 65 | 69 | 57 |
| 08.07.2024 | 67 | 76 | 62 |
| 07.07.2024 | 72 | 88 | 64 |
© Bayerisches Landesamt für Umwelt 2024