
- Start >
- Rivers >
- Waterlevel >
- Inn >
- Landshut Flutmulde >
- Chart of year

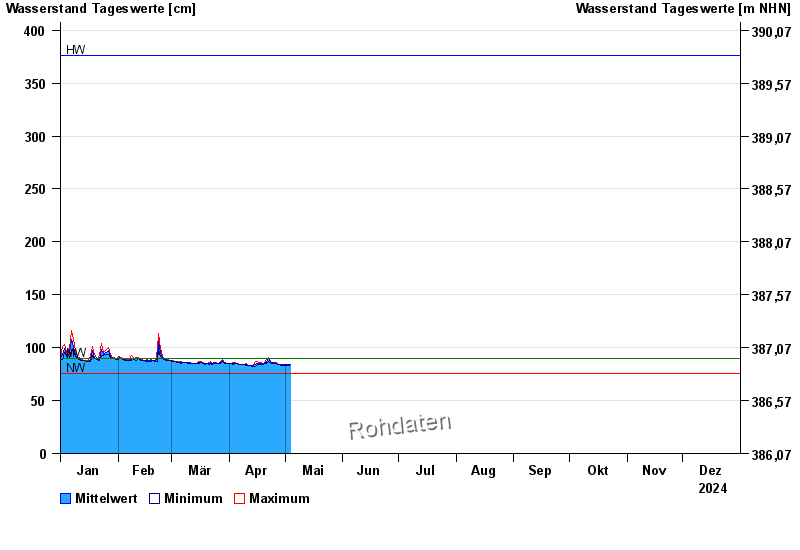
Chart of year Landshut Flutmulde / Isar
Waterlevel from 01.01.2024 to 31.12.2024
| Date | Mean value [cm] | Maximum [cm] | Minimum [cm] |
|---|---|---|---|
| 31.12.2024 | 86 | 86 | 86 |
| 30.12.2024 | 86 | 87 | 85 |
| 29.12.2024 | 87 | 87 | 86 |
| 28.12.2024 | 87 | 88 | 87 |
| 27.12.2024 | 88 | 88 | 87 |
| 26.12.2024 | 88 | 89 | 88 |
| 25.12.2024 | 90 | 90 | 89 |
© Bayerisches Landesamt für Umwelt 2024