
- Start >
- Rivers >
- Waterlevel >
- Inn >
- Lenggries >
- Chart of year

Chart of year Lenggries / Isar
Waterlevel from 01.01.2018 to 31.12.2018
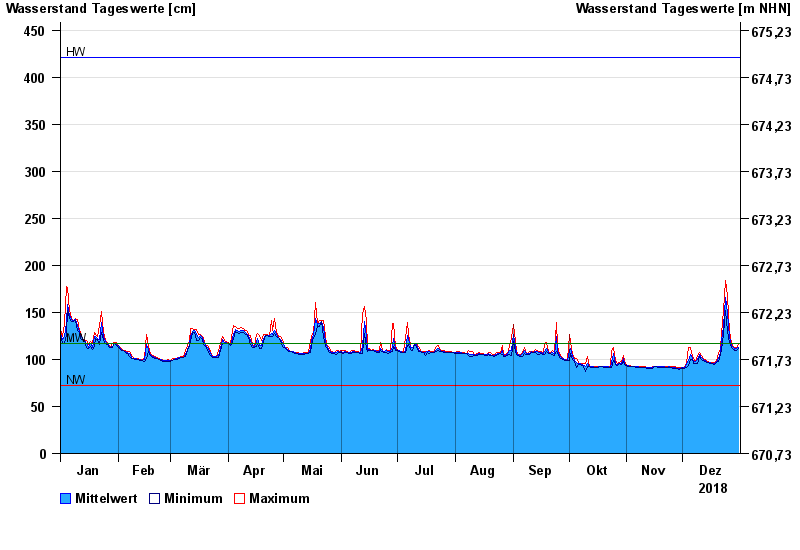
| Date | Mean value [cm] | Maximum [cm] | Minimum [cm] |
|---|---|---|---|
| 31.12.2018 | 113 | 116 | 112 |
| 30.12.2018 | 112 | 113 | 110 |
| 29.12.2018 | 111 | 112 | 110 |
| 28.12.2018 | 113 | 114 | 111 |
| 27.12.2018 | 115 | 117 | 113 |
| 26.12.2018 | 123 | 130 | 117 |
| 25.12.2018 | 150 | 167 | 130 |
© Bayerisches Landesamt für Umwelt 2025