
- Start >
- Rivers >
- Waterlevel >
- Inn >
- Mühldorf >
- Chart of year

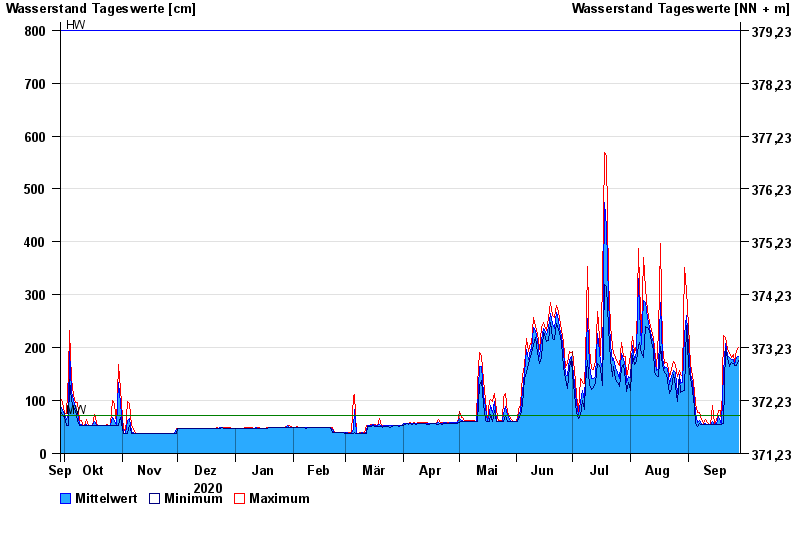
Chart of year Mühldorf / Inn
Waterlevel from 29.09.2020 to 28.09.2021
| Date | Mean value [cm] | Maximum [cm] | Minimum [cm] |
|---|---|---|---|
| 28.09.2021 | 184 | 200 | 176 |
| 27.09.2021 | 181 | 194 | 166 |
| 26.09.2021 | 169 | 172 | 166 |
| 25.09.2021 | 177 | 188 | 170 |
| 24.09.2021 | 178 | 182 | 172 |
| 23.09.2021 | 182 | 189 | 165 |
| 22.09.2021 | 186 | 198 | 180 |
© Bayerisches Landesamt für Umwelt 2024