
- Start >
- Rivers >
- Waterlevel >
- Inn >
- Oberding >
- Chart of year

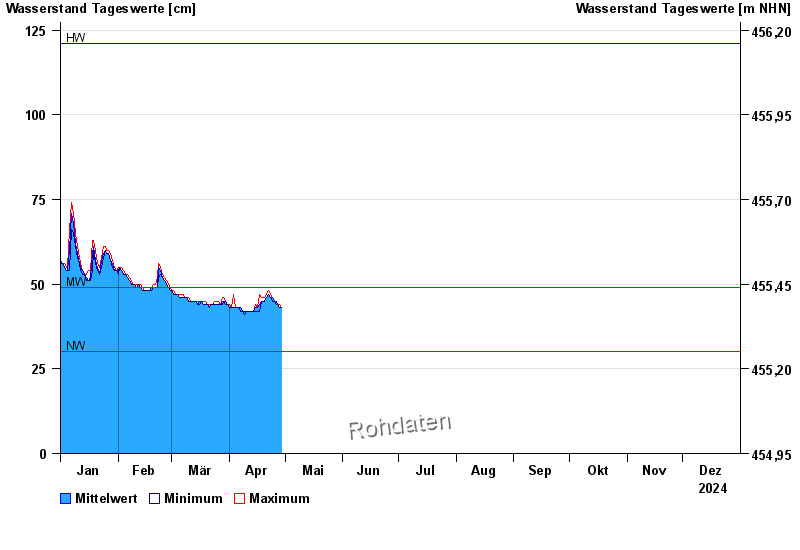
Chart of year Oberding / Gfällach
Waterlevel from 01.01.2024 to 31.12.2024
| Date | Mean value [cm] | Maximum [cm] | Minimum [cm] |
|---|---|---|---|
| 11.08.2024 | 42 | 43 | 42 |
| 10.08.2024 | 43 | 43 | 42 |
| 09.08.2024 | 43 | 43 | 43 |
| 08.08.2024 | 43 | 43 | 43 |
| 07.08.2024 | 43 | 43 | 43 |
| 06.08.2024 | 43 | 43 | 43 |
| 05.08.2024 | 44 | 44 | 43 |
© Bayerisches Landesamt für Umwelt 2024