
- Start >
- Rivers >
- Waterlevel >
- Inn >
- Passau Ingling >
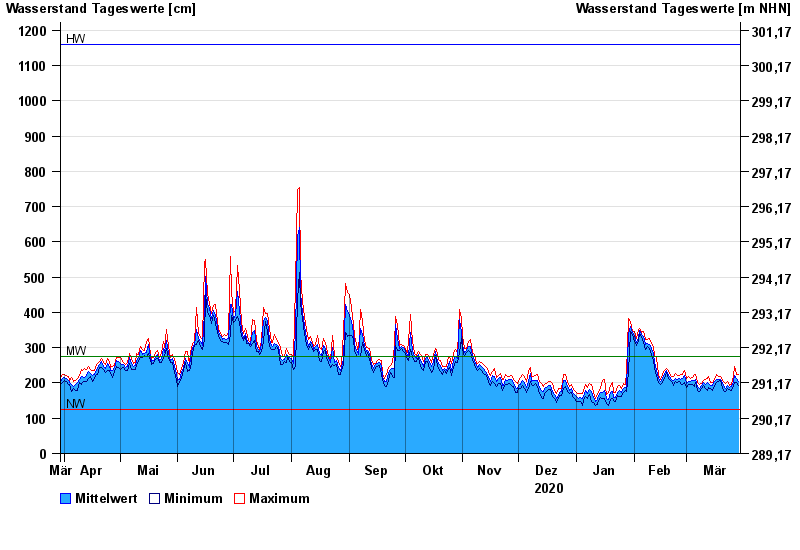
- Chart of year

Chart of year Passau Ingling / Inn
Waterlevel from 30.03.2020 to 29.03.2021
| Date | Mean value [cm] | Maximum [cm] | Minimum [cm] |
|---|---|---|---|
| 29.03.2021 | 204 | 224 | 192 |
| 28.03.2021 | 212 | 225 | 200 |
| 27.03.2021 | 220 | 248 | 201 |
| 26.03.2021 | 203 | 218 | 191 |
| 25.03.2021 | 190 | 197 | 178 |
| 24.03.2021 | 187 | 194 | 181 |
| 23.03.2021 | 193 | 203 | 183 |
© Bayerisches Landesamt für Umwelt 2024