
- Start >
- Rivers >
- Waterlevel >
- Inn >
- Prien >
- Chart of year

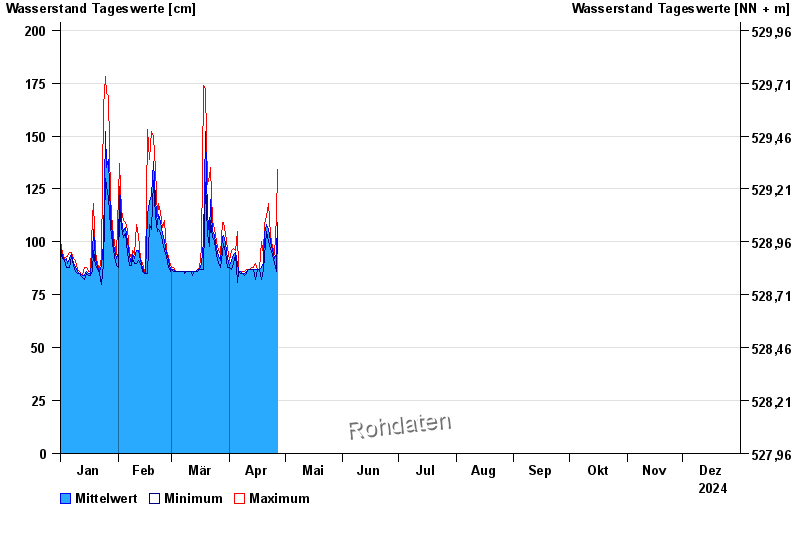
Chart of year Prien / Prien
Waterlevel from 01.01.2024 to 31.12.2024
- 02.06.2013 Wasserstand: 422 cm
- 12.08.2002 Wasserstand: 419 cm
- 03.06.2010 Wasserstand: 382 cm
- 04.08.2020 Wasserstand: 369 cm
- 20.07.1981 Wasserstand: 350 cm
| Date | Mean value [cm] | Maximum [cm] | Minimum [cm] |
|---|---|---|---|
| 23.11.2024 | 83 | 83 | 83 |
| 22.11.2024 | 84 | 85 | 83 |
| 21.11.2024 | 82 | 85 | 81 |
| 20.11.2024 | 81 | 82 | 76 |
| 19.11.2024 | 81 | 82 | 80 |
| 18.11.2024 | 82 | 84 | 82 |
| 17.11.2024 | 83 | 83 | 81 |
© Bayerisches Landesamt für Umwelt 2024