
- Start >
- Rivers >
- Waterlevel >
- Inn >
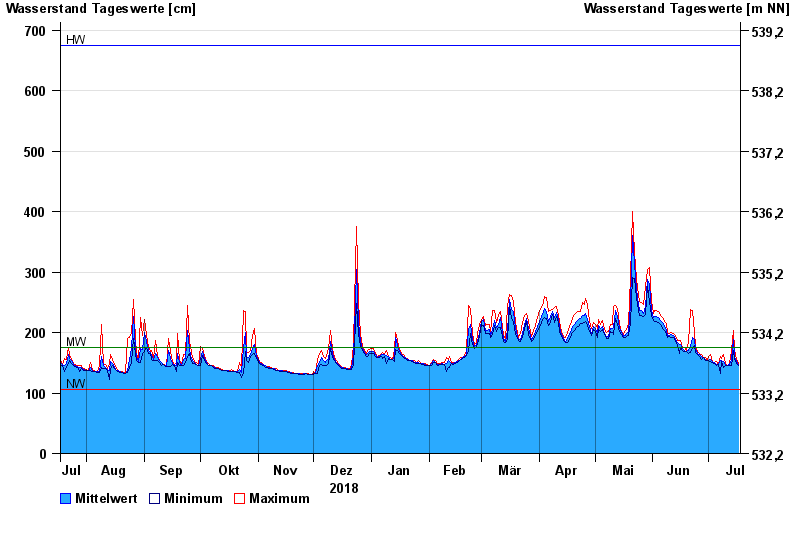
- Staudach >
- Chart of year

Chart of year Staudach / Tiroler Achen
Waterlevel from 18.07.2018 to 17.07.2019
| Date | Mean value [cm] | Maximum [cm] | Minimum [cm] |
|---|---|---|---|
| 17.07.2019 | 147 | 149 | 146 |
| 16.07.2019 | 152 | 155 | 149 |
| 15.07.2019 | 161 | 172 | 155 |
| 14.07.2019 | 189 | 204 | 170 |
| 13.07.2019 | 155 | 170 | 146 |
| 12.07.2019 | 147 | 149 | 146 |
| 11.07.2019 | 146 | 146 | 145 |
© Bayerisches Landesamt für Umwelt 2024