
- Start >
- Rivers >
- Waterlevel >
- Inn >
- Teisendorf >
- Chart of year

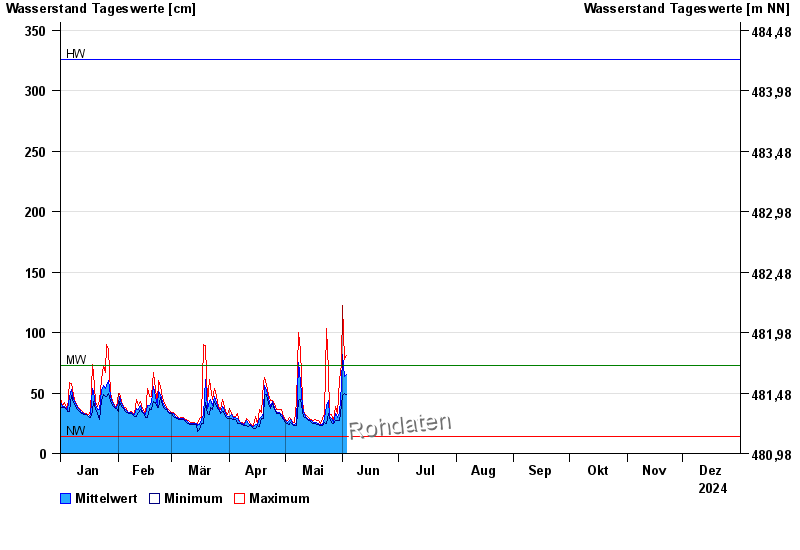
Chart of year Teisendorf / Sur
Waterlevel from 01.01.2024 to 31.12.2024
| Date | Mean value [cm] | Maximum [cm] | Minimum [cm] |
|---|---|---|---|
| 17.10.2024 | 36 | 36 | 36 |
| 16.10.2024 | 39 | 42 | 36 |
| 15.10.2024 | 44 | 46 | 40 |
| 14.10.2024 | 41 | 46 | 39 |
| 13.10.2024 | 42 | 53 | 36 |
| 12.10.2024 | 41 | 43 | 38 |
| 11.10.2024 | 49 | 56 | 43 |
© Bayerisches Landesamt für Umwelt 2024