
- Start >
- Rivers >
- Waterlevel >
- Inn >
- Weg >
- Chart of year

Chart of year Weg / Isen
Waterlevel from 14.12.2019 to 13.12.2020
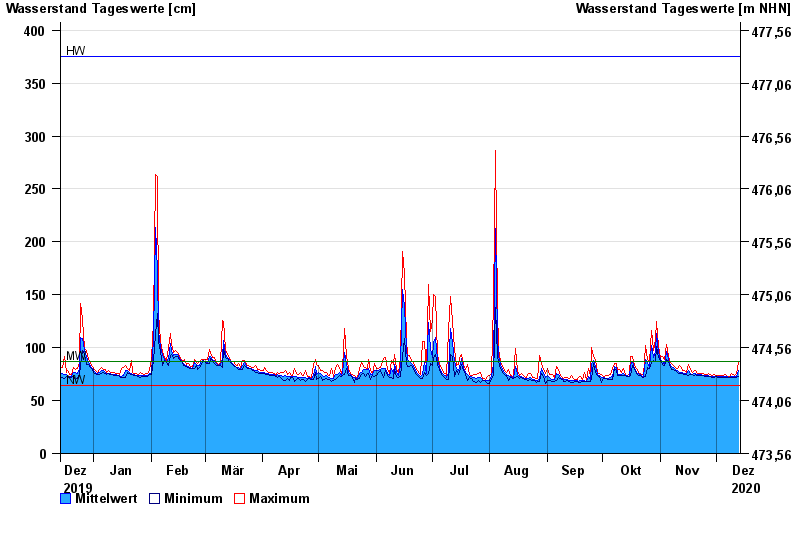
| Date | Mean value [cm] | Maximum [cm] | Minimum [cm] |
|---|---|---|---|
| 13.12.2020 | 78 | 86 | 73 |
| 12.12.2020 | 73 | 76 | 72 |
| 11.12.2020 | 73 | 74 | 72 |
| 10.12.2020 | 73 | 75 | 72 |
| 09.12.2020 | 73 | 76 | 72 |
| 08.12.2020 | 72 | 73 | 72 |
| 07.12.2020 | 73 | 73 | 72 |
© Bayerisches Landesamt für Umwelt 2025