
- Start >
- Rivers >
- Waterlevel >
- Inn >
- Weg >
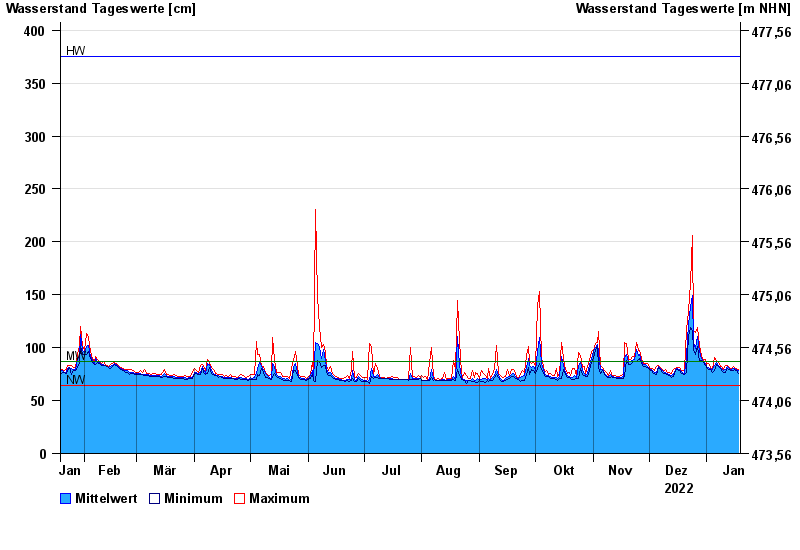
- Chart of year

Chart of year Weg / Isen
Waterlevel from 19.01.2022 to 18.01.2023
| Date | Mean value [cm] | Maximum [cm] | Minimum [cm] |
|---|---|---|---|
| 18.01.2023 | 78 | 79 | 76 |
| 17.01.2023 | 79 | 80 | 78 |
| 16.01.2023 | 80 | 81 | 79 |
| 15.01.2023 | 80 | 82 | 78 |
| 14.01.2023 | 79 | 80 | 78 |
| 13.01.2023 | 80 | 81 | 79 |
| 12.01.2023 | 82 | 83 | 80 |
© Bayerisches Landesamt für Umwelt 2024