
- Start >
- Rivers >
- Waterlevel >
- Isar >
- Bad Aibling >
- Chart of year

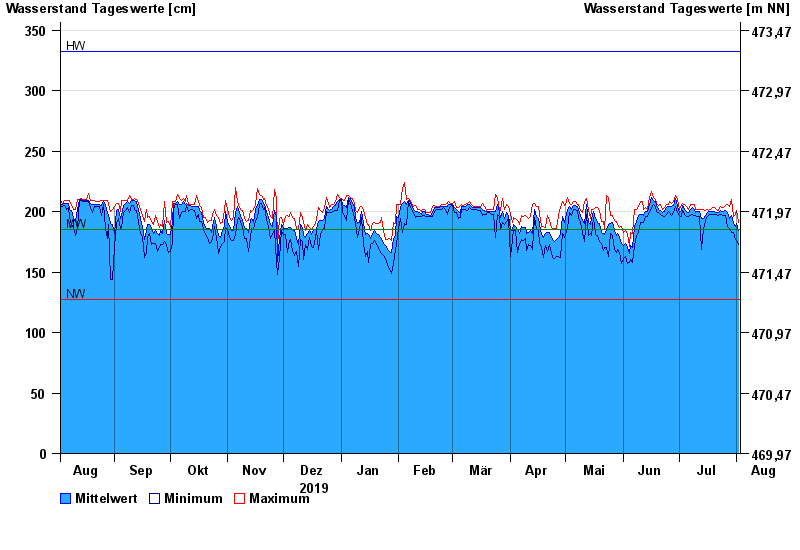
Chart of year Bad Aibling / Triftbach linker Mühlkanal
Waterlevel from 03.08.2019 to 02.08.2020
| Date | Mean value [cm] | Maximum [cm] | Minimum [cm] |
|---|---|---|---|
| 02.08.2020 | 184 | 191 | 173 |
| 01.08.2020 | 190 | 201 | 176 |
| 31.07.2020 | 188 | 198 | 177 |
| 30.07.2020 | 190 | 196 | 183 |
| 29.07.2020 | 197 | 210 | 183 |
| 28.07.2020 | 194 | 204 | 186 |
| 27.07.2020 | 199 | 206 | 188 |
© Bayerisches Landesamt für Umwelt 2024