
- Start >
- Rivers >
- Waterlevel >
- Isar >
- Bad Aibling >
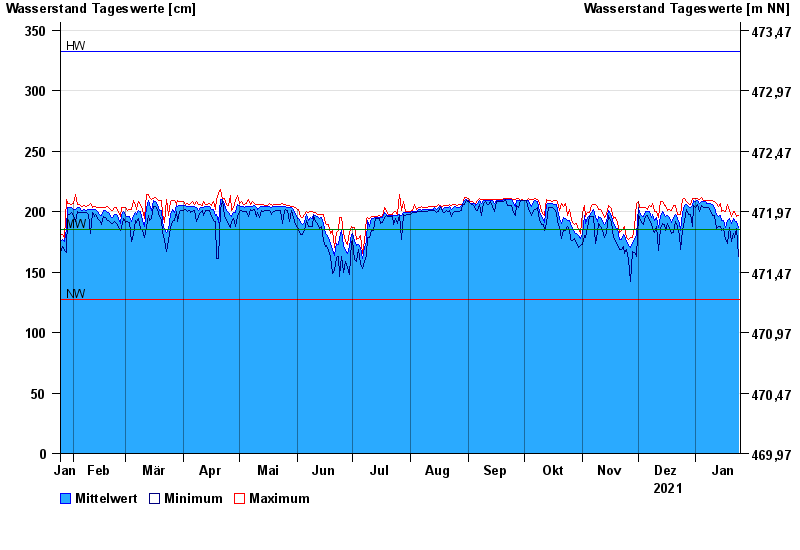
- Chart of year

Chart of year Bad Aibling / Triftbach linker Mühlkanal
Waterlevel from 25.01.2021 to 24.01.2022
| Date | Mean value [cm] | Maximum [cm] | Minimum [cm] |
|---|---|---|---|
| 24.01.2022 | 187 | 197 | 163 |
| 23.01.2022 | 192 | 196 | 186 |
| 22.01.2022 | 193 | 200 | 179 |
| 21.01.2022 | 194 | 200 | 182 |
| 20.01.2022 | 190 | 196 | 175 |
| 19.01.2022 | 194 | 201 | 187 |
| 18.01.2022 | 193 | 206 | 174 |
© Bayerisches Landesamt für Umwelt 2024