
- Start >
- Rivers >
- Waterlevel >
- Isar >
- Bad Aibling >
- Chart of year

Chart of year Bad Aibling / Triftbach linker Mühlkanal
Waterlevel from 29.10.2020 to 28.10.2021
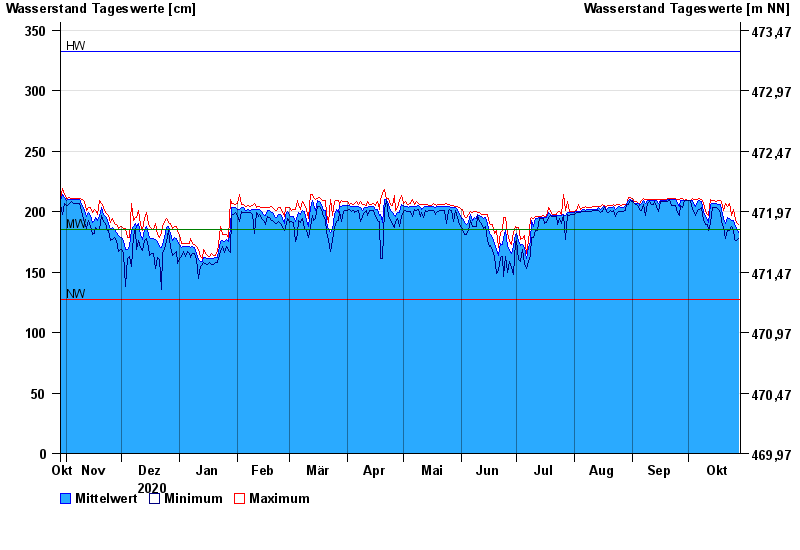
| Date | Mean value [cm] | Maximum [cm] | Minimum [cm] |
|---|---|---|---|
| 28.10.2021 | 183 | 189 | 178 |
| 27.10.2021 | 186 | 191 | 176 |
| 26.10.2021 | 189 | 197 | 177 |
| 25.10.2021 | 193 | 202 | 185 |
| 24.10.2021 | 193 | 197 | 188 |
| 23.10.2021 | 194 | 207 | 184 |
| 22.10.2021 | 195 | 204 | 184 |
© Bayerisches Landesamt für Umwelt 2024