
- Start >
- Rivers >
- Waterlevel >
- Isar >
- Beuerberg >
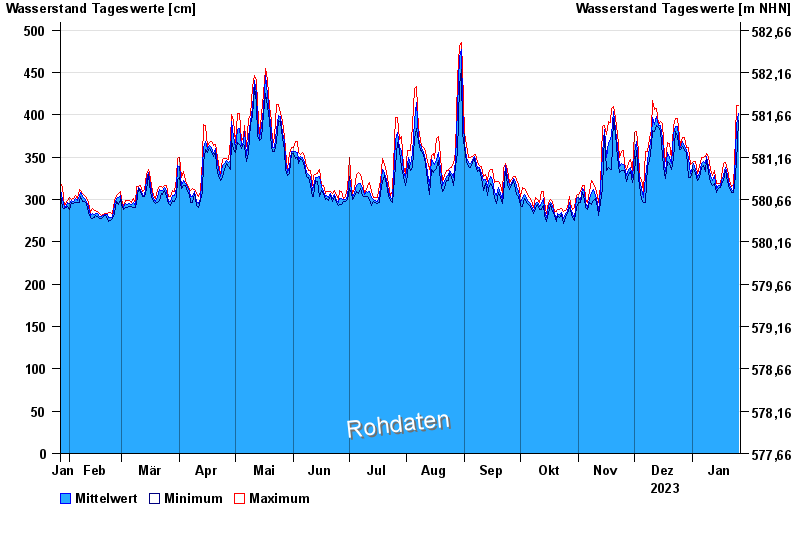
- Chart of year

Chart of year Beuerberg / Loisach
Waterlevel from 27.01.2023 to 26.01.2024
- 24.05.1999 Wasserstand: 572 cm
- 23.08.2005 Wasserstand: 564 cm
- 03.06.2013 Wasserstand: 556 cm
- 18.06.1979 Wasserstand: 556 cm
- 04.08.2020 Wasserstand: 532 cm
| Date | Mean value [cm] | Maximum [cm] | Minimum [cm] |
|---|---|---|---|
| 26.01.2024 | 402 | 411 | 393 |
| 25.01.2024 | 388 | 411 | 344 |
| 24.01.2024 | 325 | 344 | 315 |
| 23.01.2024 | 312 | 317 | 308 |
| 22.01.2024 | 312 | 315 | 308 |
| 21.01.2024 | 317 | 322 | 313 |
| 20.01.2024 | 328 | 335 | 321 |
© Bayerisches Landesamt für Umwelt 2024