
- Start >
- Rivers >
- Waterlevel >
- Isar >
- Bruggen >
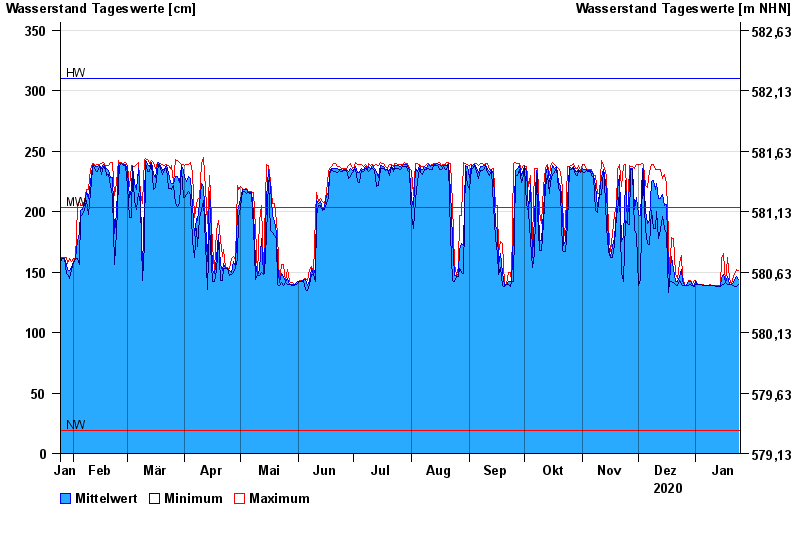
- Chart of year

Chart of year Bruggen / Loisach-Isar-Kanal
Waterlevel from 25.01.2020 to 24.01.2021
Date | Mean value [cm] | Maximum [cm] | Minimum [cm] |
|---|---|---|---|
| 24.01.2021 | 144 | 151 | 140 |
| 23.01.2021 | 146 | 152 | 138 |
| 22.01.2021 | 144 | 148 | 138 |
| 21.01.2021 | 141 | 147 | 139 |
| 20.01.2021 | 140 | 140 | 140 |
| 19.01.2021 | 140 | 145 | 140 |
| 18.01.2021 | 146 | 162 | 140 |
© Bayerisches Landesamt für Umwelt 2025