
- Start >
- Rivers >
- Waterlevel >
- Isar >
- Druisheim >
- Chart of year

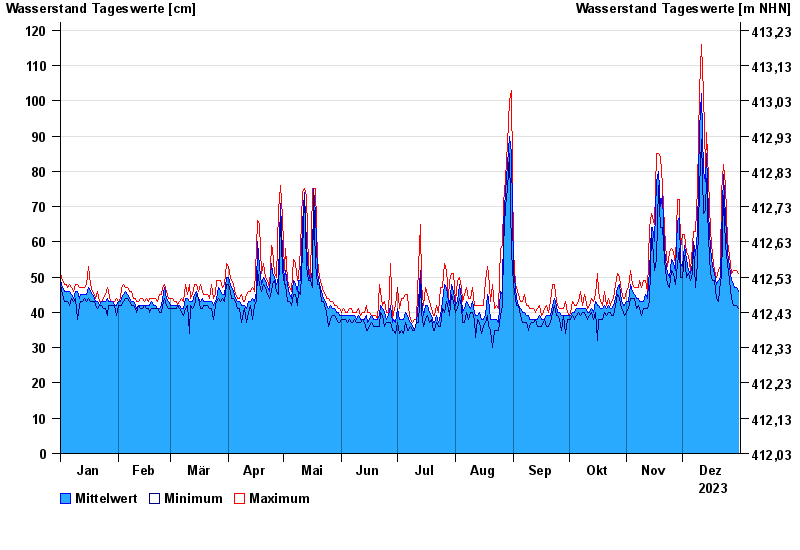
Chart of year Druisheim / Schmutter
Waterlevel from 01.01.2023 to 31.12.2023
| Date | Mean value [cm] | Maximum [cm] | Minimum [cm] |
|---|---|---|---|
| 31.12.2023 | 46 | 51 | 41 |
| 30.12.2023 | 47 | 52 | 42 |
| 29.12.2023 | 47 | 52 | 42 |
| 28.12.2023 | 48 | 52 | 42 |
| 27.12.2023 | 49 | 51 | 44 |
| 26.12.2023 | 53 | 56 | 49 |
| 25.12.2023 | 57 | 60 | 54 |
© Bayerisches Landesamt für Umwelt 2025