
- Start >
- Rivers >
- Waterlevel >
- Isar >
- Fritz am Sand >
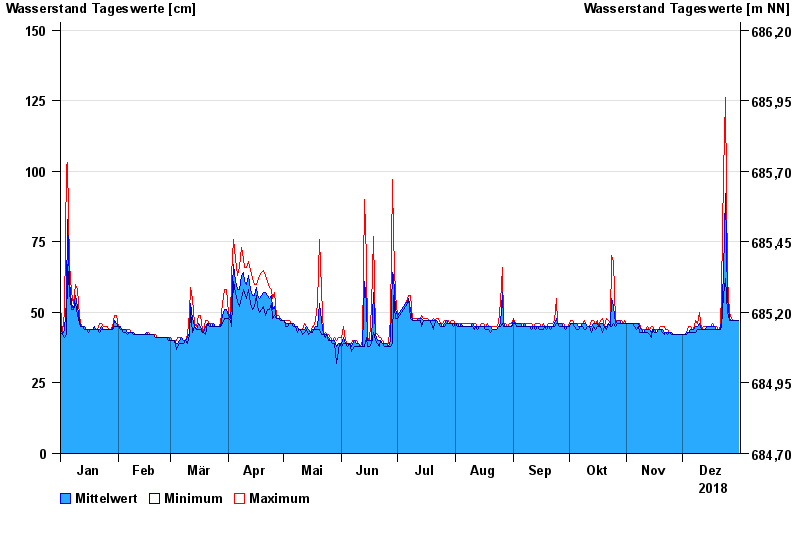
- Chart of year

Chart of year Fritz am Sand / Weiße Traun
Waterlevel from 01.01.2018 to 31.12.2018
- Hochwassergefahrenfläche HQ100 220 cm
| Date | Mean value [cm] | Maximum [cm] | Minimum [cm] |
|---|---|---|---|
| 31.12.2018 | 47 | 47 | 47 |
| 30.12.2018 | 47 | 47 | 47 |
| 29.12.2018 | 47 | 47 | 47 |
| 28.12.2018 | 47 | 47 | 47 |
| 27.12.2018 | 47 | 48 | 47 |
| 26.12.2018 | 48 | 50 | 47 |
| 25.12.2018 | 55 | 62 | 50 |
© Bayerisches Landesamt für Umwelt 2025