
- Start >
- Rivers >
- Waterlevel >
- Isar >
- Fritz am Sand >
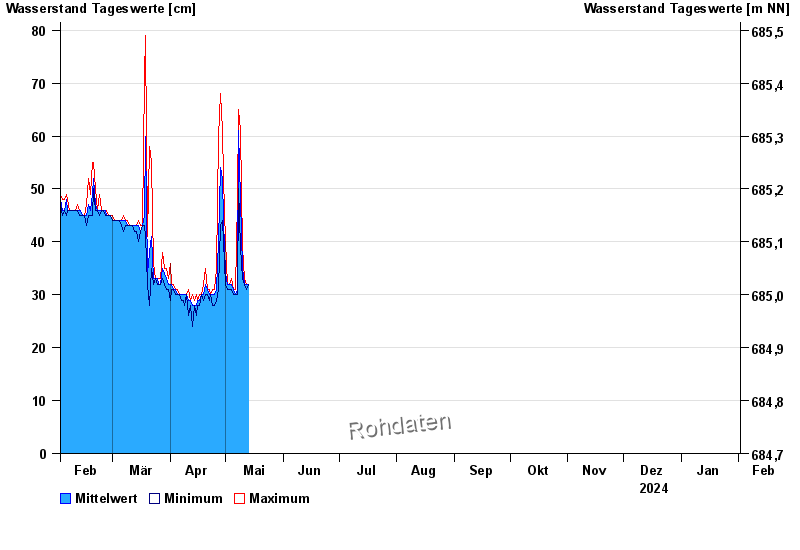
- Chart of year

Chart of year Fritz am Sand / Weiße Traun
Waterlevel from 02.02.2024 to 01.02.2025
- Hochwassergefahrenfläche HQ100 220 cm
| Date | Mean value [cm] | Maximum [cm] | Minimum [cm] |
|---|---|---|---|
| 16.10.2024 | 46 | 47 | 46 |
| 15.10.2024 | 52 | 61 | 46 |
| 14.10.2024 | 47 | 50 | 44 |
| 13.10.2024 | 47 | 48 | 47 |
| 12.10.2024 | 48 | 49 | 47 |
| 11.10.2024 | 54 | 62 | 49 |
| 10.10.2024 | 58 | 83 | 45 |
© Bayerisches Landesamt für Umwelt 2024