
- Start >
- Rivers >
- Waterlevel >
- Isar >
- Garmisch u. d. Partnachmündung >
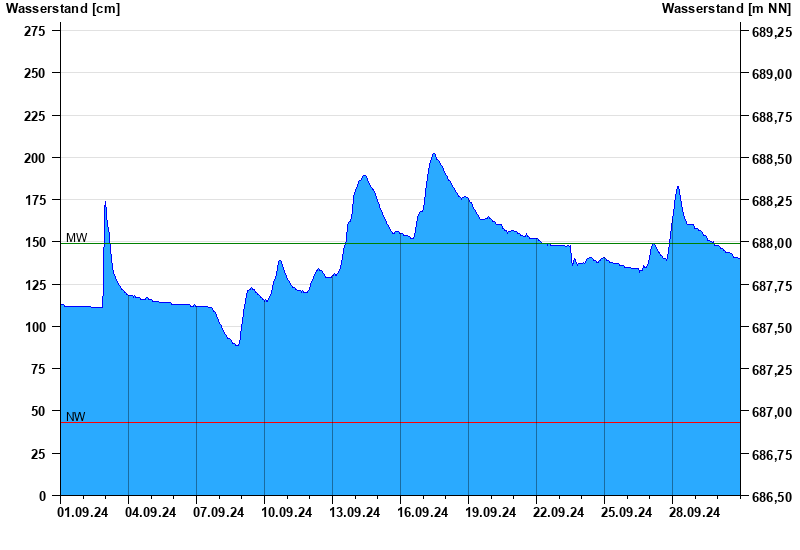
- Chart of month

Chart of month Garmisch u. d. Partnachmündung / Loisach
Waterlevel from 01.09.2024 to 30.09.2024
note
Messwerte beeinflusst durch Kraftwerkssteuerung.
| Date | Waterlevel [cm] |
|---|---|
| 01.10.2024 00:45 | 140 |
| 01.10.2024 00:30 | 139 |
| 01.10.2024 00:15 | 140 |
| 01.10.2024 00:00 | 140 |
| 30.09.2024 23:45 | 140 |
| 30.09.2024 23:30 | 140 |
| 30.09.2024 23:15 | 140 |
© Bayerisches Landesamt für Umwelt 2025