
- Start >
- Rivers >
- Waterlevel >
- Isar >
- Großschwindau >
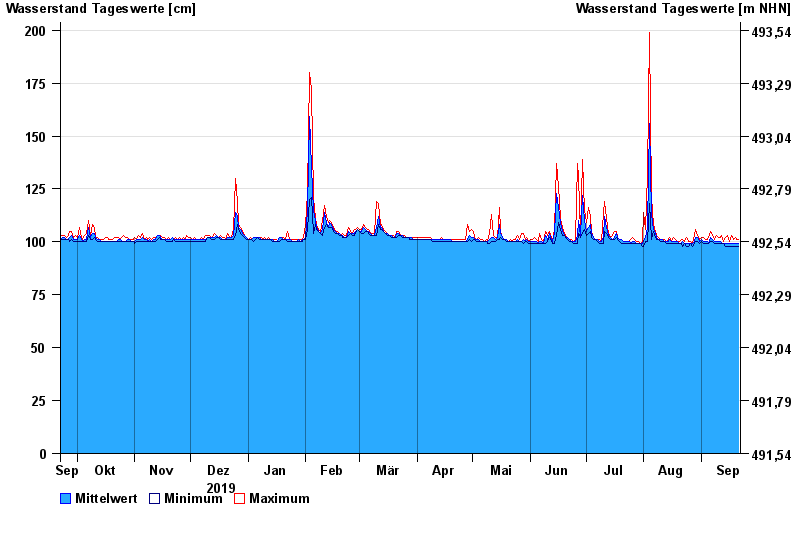
- Chart of year

Chart of year Großschwindau / Goldach
Waterlevel from 22.09.2019 to 21.09.2020
| Date | Mean value [cm] | Maximum [cm] | Minimum [cm] |
|---|---|---|---|
| 21.09.2020 | 99 | 101 | 98 |
| 20.09.2020 | 99 | 101 | 98 |
| 19.09.2020 | 99 | 102 | 98 |
| 18.09.2020 | 99 | 101 | 98 |
| 17.09.2020 | 99 | 103 | 98 |
| 16.09.2020 | 99 | 100 | 98 |
| 15.09.2020 | 99 | 103 | 98 |
© Bayerisches Landesamt für Umwelt 2024