
- Start >
- Rivers >
- Waterlevel >
- Isar >
- Kirchberg >
- Chart of year

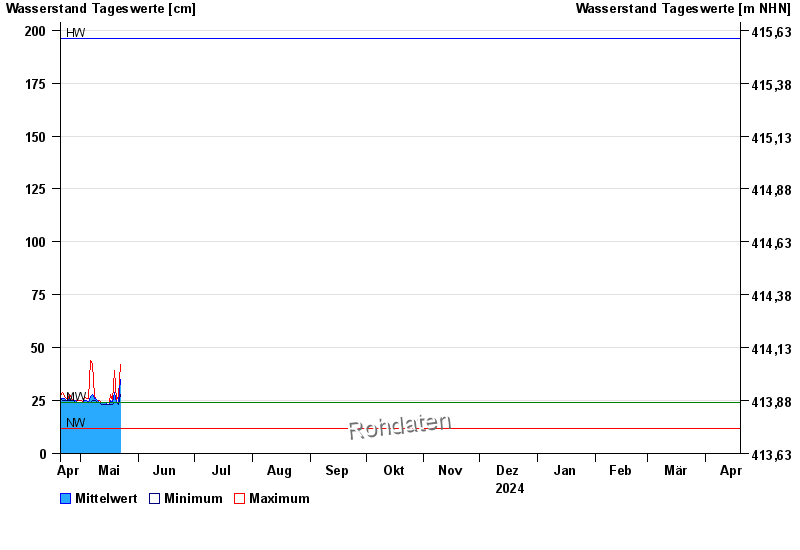
Chart of year Kirchberg / Mertseebach
Waterlevel from 20.04.2024 to 19.04.2025
| Date | Mean value [cm] | Maximum [cm] | Minimum [cm] |
|---|---|---|---|
| 15.10.2024 | 31 | 32 | 29 |
| 14.10.2024 | 29 | 31 | 28 |
| 13.10.2024 | 29 | 30 | 28 |
| 12.10.2024 | 29 | 29 | 29 |
| 11.10.2024 | 29 | 30 | 29 |
| 10.10.2024 | 32 | 33 | 30 |
| 09.10.2024 | 38 | 48 | 30 |
© Bayerisches Landesamt für Umwelt 2024