
- Start >
- Rivers >
- Waterlevel >
- Isar >
- Lenggries >
- Chart of year

Chart of year Lenggries / Isar
Waterlevel from 27.05.2020 to 26.05.2021
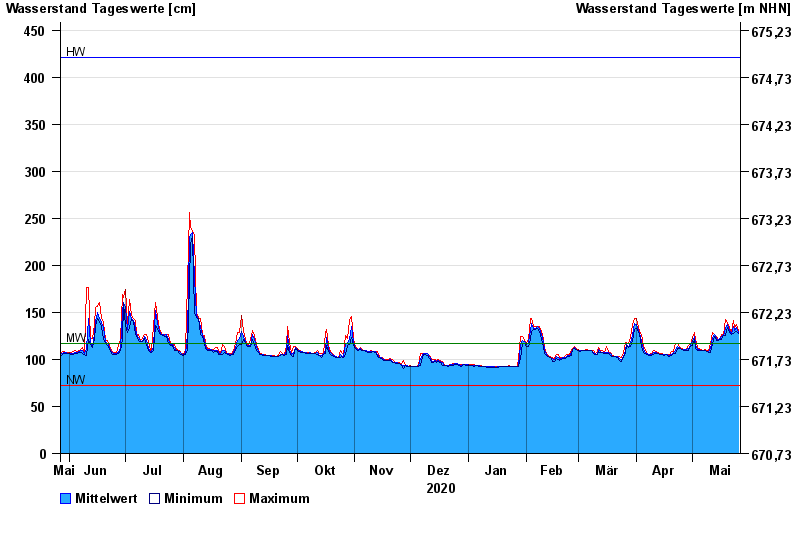
| Date | Mean value [cm] | Maximum [cm] | Minimum [cm] |
|---|---|---|---|
| 26.05.2021 | 129 | 131 | 128 |
| 25.05.2021 | 134 | 137 | 130 |
| 24.05.2021 | 131 | 134 | 129 |
| 23.05.2021 | 135 | 141 | 128 |
| 22.05.2021 | 128 | 129 | 127 |
| 21.05.2021 | 131 | 134 | 129 |
| 20.05.2021 | 137 | 139 | 134 |
© Bayerisches Landesamt für Umwelt 2024