
- Start >
- Rivers >
- Waterlevel >
- Isar >
- München >
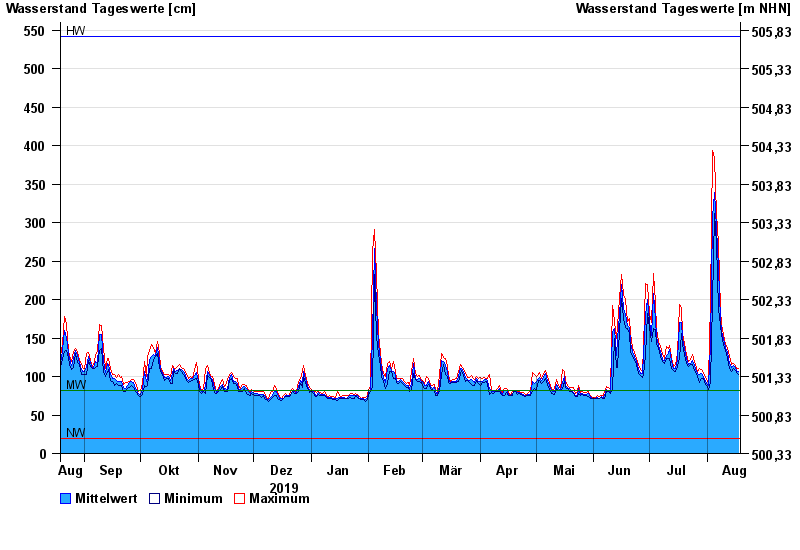
- Chart of year

Chart of year München / Isar
Waterlevel from 19.08.2019 to 18.08.2020
| Date | Mean value [cm] | Maximum [cm] | Minimum [cm] |
|---|---|---|---|
| 18.08.2020 | 106 | 110 | 102 |
| 17.08.2020 | 108 | 110 | 105 |
| 16.08.2020 | 112 | 114 | 108 |
| 15.08.2020 | 114 | 117 | 110 |
| 14.08.2020 | 112 | 116 | 107 |
| 13.08.2020 | 117 | 126 | 111 |
| 12.08.2020 | 131 | 138 | 124 |
© Bayerisches Landesamt für Umwelt 2024