
- Start >
- Rivers >
- Waterlevel >
- Isar >
- München >
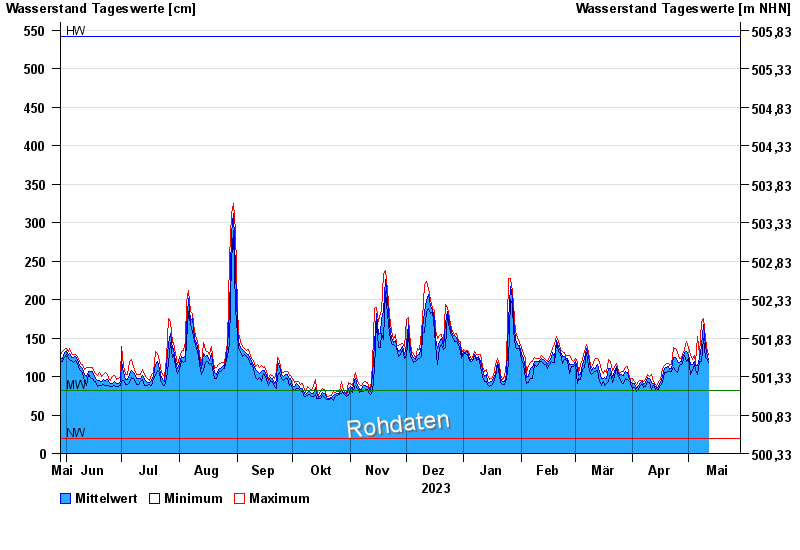
- Chart of year

Chart of year München / Isar
Waterlevel from 29.05.2023 to 28.05.2024
| Date | Mean value [cm] | Maximum [cm] | Minimum [cm] |
|---|---|---|---|
| 28.05.2024 | 159 | 201 | 117 |
| 27.05.2024 | 108 | 127 | 101 |
| 26.05.2024 | 114 | 122 | 105 |
| 25.05.2024 | 129 | 133 | 122 |
| 24.05.2024 | 138 | 148 | 128 |
| 23.05.2024 | 119 | 133 | 114 |
| 22.05.2024 | 115 | 120 | 106 |
© Bayerisches Landesamt für Umwelt 2024