
- Start >
- Rivers >
- Waterlevel >
- Isar >
- Oberach >
- Chart of month

Chart of month Oberach / Weißach
Waterlevel from 01.08.2021 to 31.08.2021
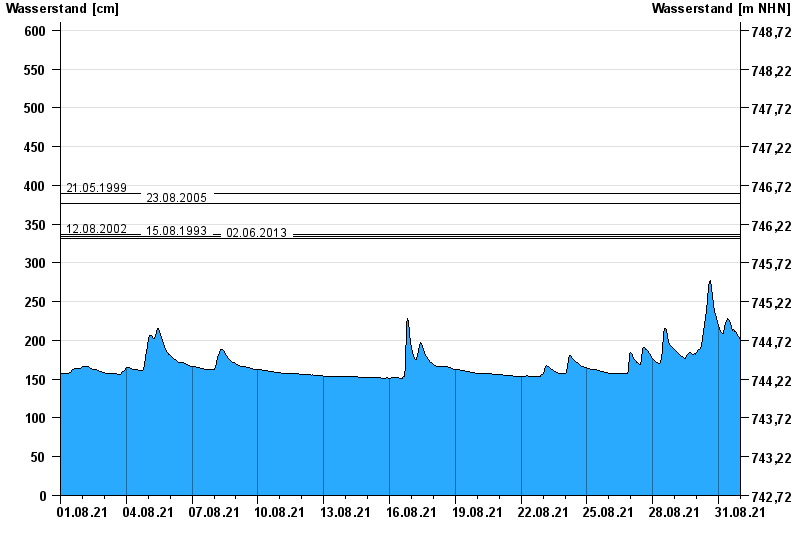
- 21.05.1999 Wasserstand: 390 cm
- 23.08.2005 Wasserstand: 377 cm
- 12.08.2002 Wasserstand: 337 cm
- 15.08.1993 Wasserstand: 334 cm
- 02.06.2013 Wasserstand: 332 cm
| Date | Waterlevel [cm] |
|---|---|
| 01.09.2021 00:45 | 199 |
| 01.09.2021 00:30 | 200 |
| 01.09.2021 00:15 | 200 |
| 01.09.2021 00:00 | 200 |
| 31.08.2021 23:45 | 201 |
| 31.08.2021 23:30 | 201 |
| 31.08.2021 23:15 | 202 |
© Bayerisches Landesamt für Umwelt 2024