
- Start >
- Rivers >
- Waterlevel >
- Isar >
- Oberhausen >
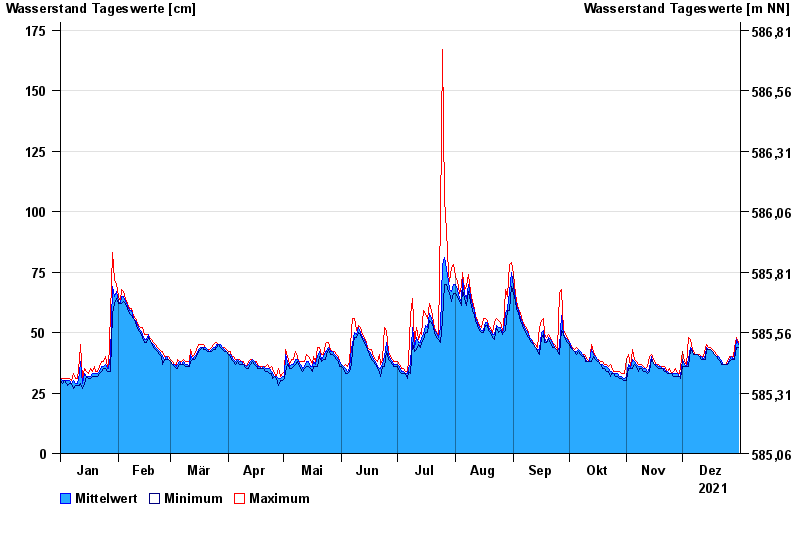
- Chart of year

Chart of year Oberhausen / Ach
Waterlevel from 01.01.2021 to 31.12.2021
- 09.06.2016 Wasserstand: 219 cm
- 31.07.1977 Wasserstand: 218 cm
- 21.05.1999 Wasserstand: 201 cm
- 23.08.2005 Wasserstand: 199 cm
- 25.05.1971 Wasserstand: 193 cm
| Date | Mean value [cm] | Maximum [cm] | Minimum [cm] |
|---|---|---|---|
| 31.12.2021 | 45 | 46 | 44 |
| 30.12.2021 | 47 | 48 | 44 |
| 29.12.2021 | 40 | 44 | 39 |
| 28.12.2021 | 39 | 40 | 39 |
| 27.12.2021 | 40 | 40 | 39 |
| 26.12.2021 | 39 | 40 | 38 |
| 25.12.2021 | 37 | 38 | 37 |
© Bayerisches Landesamt für Umwelt 2025