
- Start >
- Rivers >
- Waterlevel >
- Isar >
- Odelzhausen >
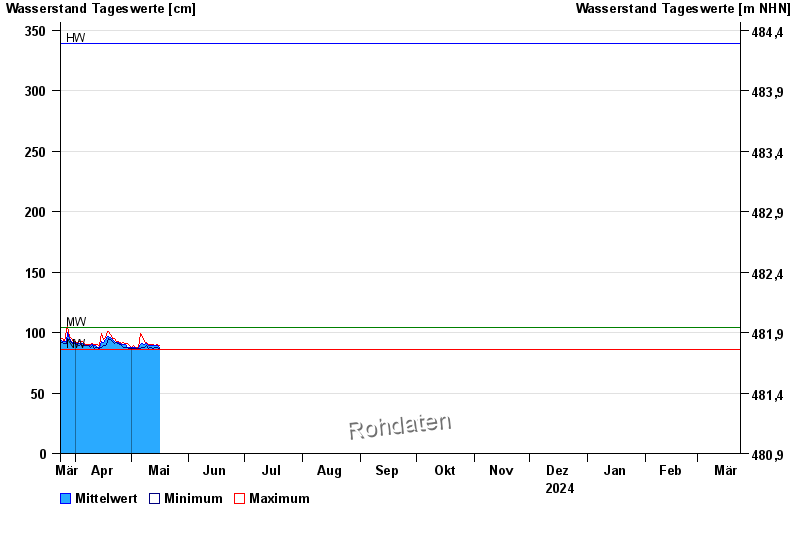
- Chart of year

Chart of year Odelzhausen / Glonn
Waterlevel from 24.03.2024 to 23.03.2025
| Date | Mean value [cm] | Maximum [cm] | Minimum [cm] |
|---|---|---|---|
| 28.12.2024 | 99 | 100 | 98 |
| 27.12.2024 | 100 | 101 | 99 |
| 26.12.2024 | 101 | 103 | 98 |
| 25.12.2024 | 105 | 107 | 103 |
| 24.12.2024 | 110 | 113 | 107 |
| 23.12.2024 | 123 | 144 | 113 |
| 22.12.2024 | 125 | 160 | 98 |
© Bayerisches Landesamt für Umwelt 2024