
- Start >
- Rivers >
- Waterlevel >
- Isar >
- Plattling >
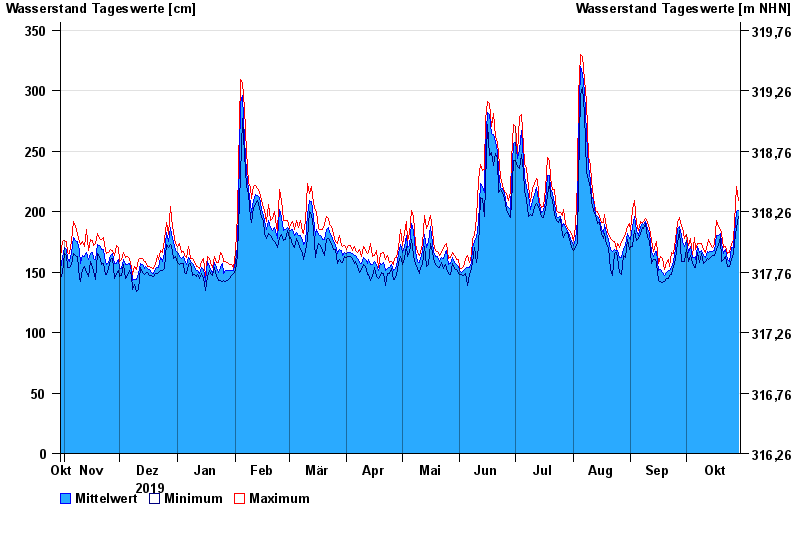
- Chart of year

Chart of year Plattling / Isar
Waterlevel from 30.10.2019 to 29.10.2020
| Date | Mean value [cm] | Maximum [cm] | Minimum [cm] |
|---|---|---|---|
| 29.10.2020 | 201 | 209 | 196 |
| 28.10.2020 | 200 | 221 | 187 |
| 27.10.2020 | 182 | 191 | 174 |
| 26.10.2020 | 170 | 177 | 165 |
| 25.10.2020 | 170 | 173 | 160 |
| 24.10.2020 | 159 | 166 | 155 |
| 23.10.2020 | 160 | 165 | 155 |
© Bayerisches Landesamt für Umwelt 2024