
- Start >
- Rivers >
- Waterlevel >
- Isar >
- Plattling >
- Chart of year

Chart of year Plattling / Isar
Waterlevel from 01.01.2020 to 31.12.2020
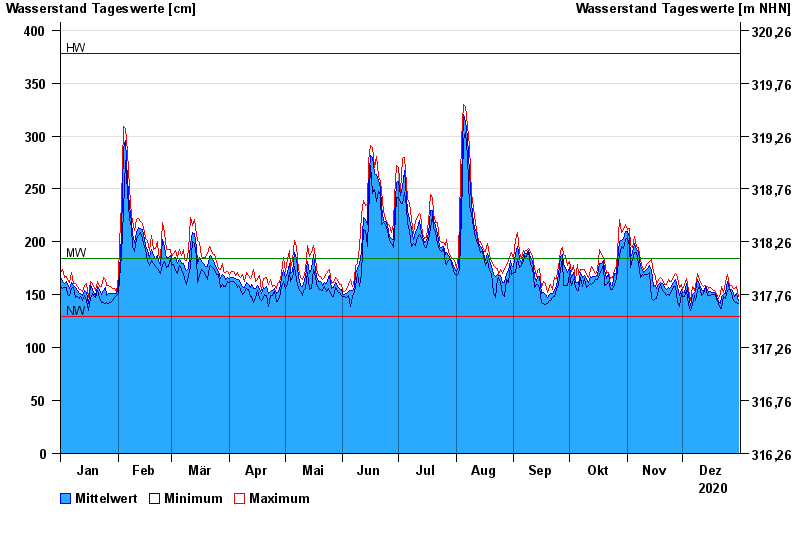
| Date | Mean value [cm] | Maximum [cm] | Minimum [cm] |
|---|---|---|---|
| 31.12.2020 | 145 | 148 | 142 |
| 30.12.2020 | 151 | 158 | 143 |
| 29.12.2020 | 148 | 156 | 144 |
| 28.12.2020 | 151 | 156 | 145 |
| 27.12.2020 | 155 | 159 | 151 |
| 26.12.2020 | 156 | 158 | 155 |
| 25.12.2020 | 163 | 169 | 154 |
© Bayerisches Landesamt für Umwelt 2025