
- Start >
- Rivers >
- Waterlevel >
- Isar >
- Plattling >
- Chart of year

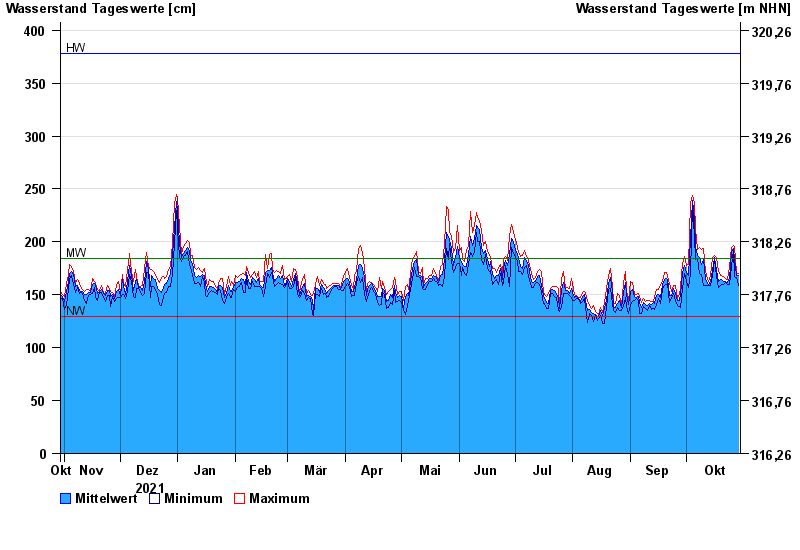
Chart of year Plattling / Isar
Waterlevel from 30.10.2021 to 29.10.2022
| Date | Mean value [cm] | Maximum [cm] | Minimum [cm] |
|---|---|---|---|
| 29.10.2022 | 168 | 170 | 159 |
| 28.10.2022 | 168 | 171 | 166 |
| 27.10.2022 | 183 | 196 | 167 |
| 26.10.2022 | 194 | 197 | 192 |
| 25.10.2022 | 191 | 195 | 177 |
| 24.10.2022 | 165 | 177 | 160 |
| 23.10.2022 | 162 | 164 | 160 |
© Bayerisches Landesamt für Umwelt 2024