
- Start >
- Rivers >
- Waterlevel >
- Isar >
- Prien >
- Chart of year

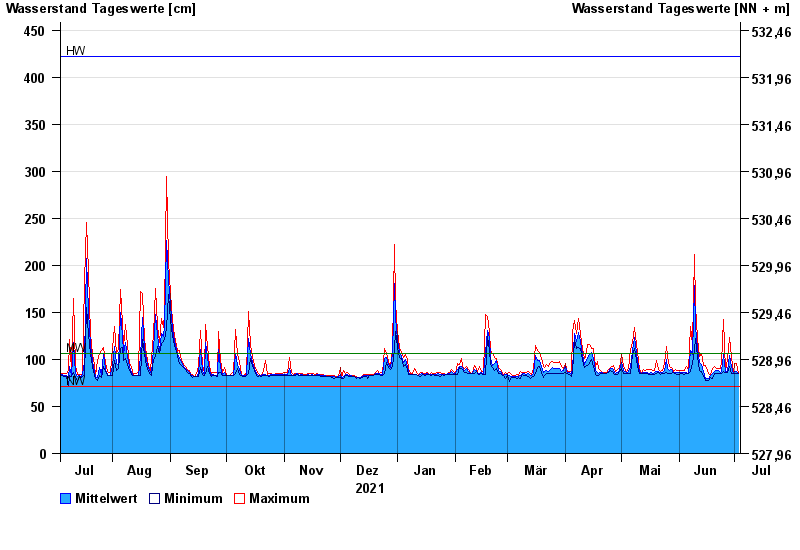
Chart of year Prien / Prien
Waterlevel from 04.07.2021 to 03.07.2022
| Date | Mean value [cm] | Maximum [cm] | Minimum [cm] |
|---|---|---|---|
| 03.07.2022 | 85 | 85 | 85 |
| 02.07.2022 | 87 | 96 | 85 |
| 01.07.2022 | 87 | 96 | 85 |
| 30.06.2022 | 85 | 86 | 85 |
| 29.06.2022 | 92 | 102 | 85 |
| 28.06.2022 | 104 | 123 | 93 |
| 27.06.2022 | 87 | 100 | 86 |
© Bayerisches Landesamt für Umwelt 2024