
- Start >
- Rivers >
- Waterlevel >
- Isar >
- Raisting >
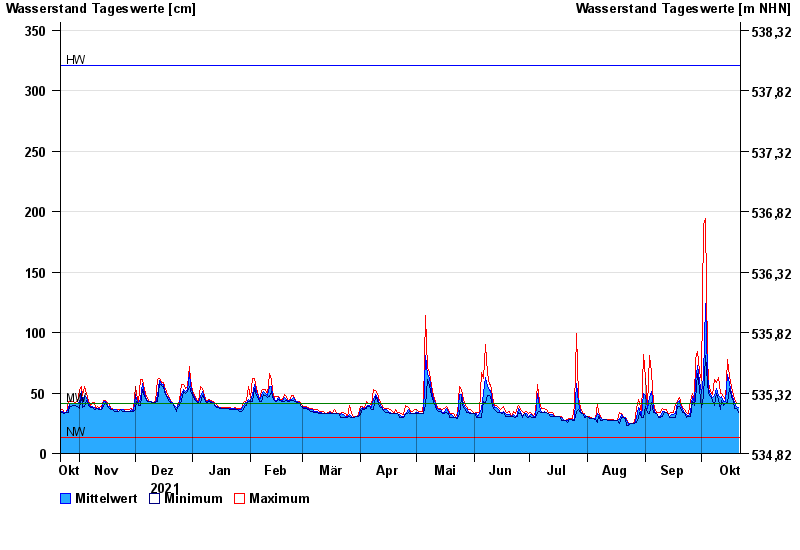
- Chart of year

Chart of year Raisting / Rott
Waterlevel from 22.10.2021 to 21.10.2022
| Date | Mean value [cm] | Maximum [cm] | Minimum [cm] |
|---|---|---|---|
| 21.10.2022 | 38 | 41 | 34 |
| 20.10.2022 | 39 | 42 | 37 |
| 19.10.2022 | 41 | 45 | 37 |
| 18.10.2022 | 45 | 48 | 43 |
| 17.10.2022 | 50 | 55 | 47 |
| 16.10.2022 | 58 | 64 | 54 |
| 15.10.2022 | 65 | 78 | 42 |
© Bayerisches Landesamt für Umwelt 2024