
- Start >
- Rivers >
- Waterlevel >
- Isar >
- Rosenheim >
- Chart of year

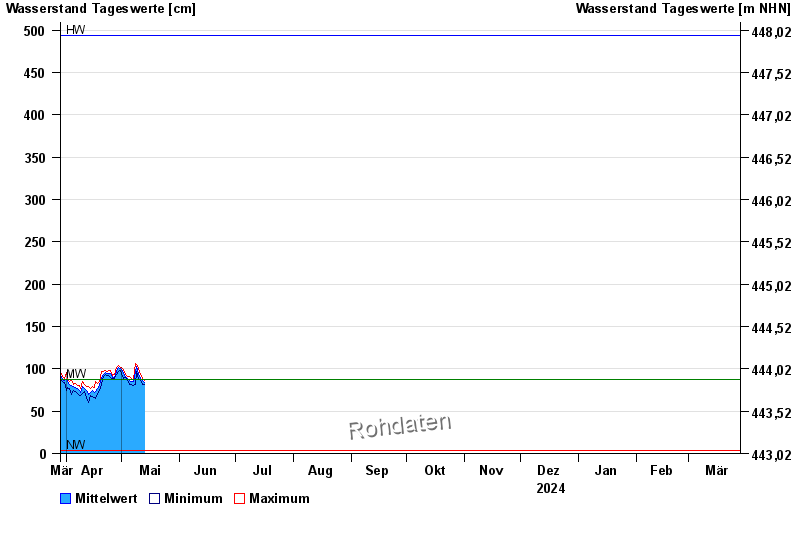
Chart of year Rosenheim / Mangfall
Waterlevel from 29.03.2024 to 28.03.2025
| Date | Mean value [cm] | Maximum [cm] | Minimum [cm] |
|---|---|---|---|
| 13.07.2024 | 115 | 130 | 105 |
| 12.07.2024 | 96 | 103 | 91 |
| 11.07.2024 | 108 | 122 | 98 |
| 10.07.2024 | 97 | 123 | 88 |
| 09.07.2024 | 96 | 101 | 93 |
| 08.07.2024 | 101 | 110 | 94 |
| 07.07.2024 | 100 | 108 | 98 |
© Bayerisches Landesamt für Umwelt 2024