
- Start >
- Rivers >
- Waterlevel >
- Isar >
- Rosenheim o.d. Mangfallmündung >
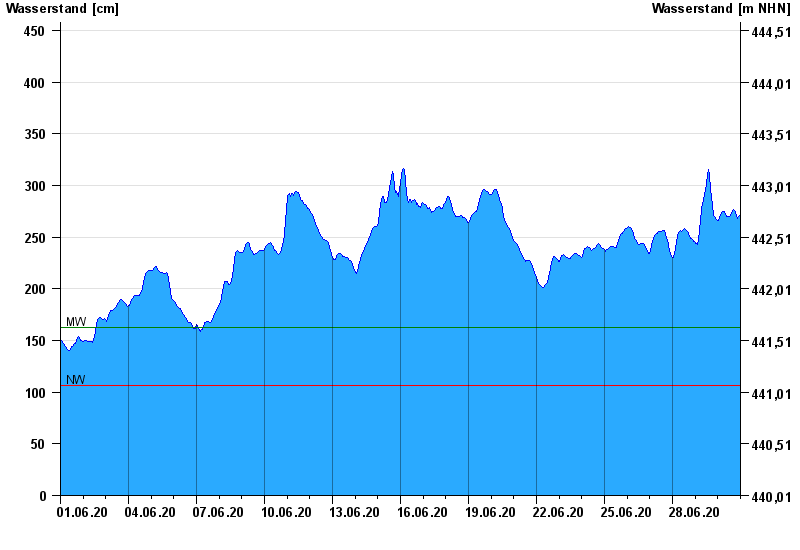
- Chart of month

Chart of month Rosenheim o.d. Mangfallmündung / Inn
Waterlevel from 01.06.2020 to 30.06.2020
| Date | Waterlevel [cm] |
|---|---|
| 01.07.2020 00:45 | 271 |
| 01.07.2020 00:30 | 272 |
| 01.07.2020 00:15 | 271 |
| 01.07.2020 00:00 | 271 |
| 30.06.2020 23:45 | 271 |
| 30.06.2020 23:30 | 271 |
| 30.06.2020 23:15 | 271 |
© Bayerisches Landesamt für Umwelt 2024