
- Start >
- Rivers >
- Waterlevel >
- Isar >
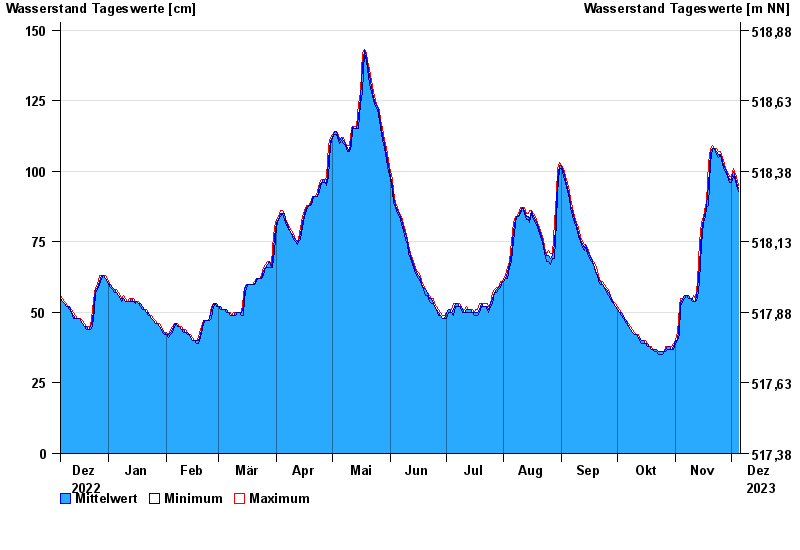
- Seebruck >
- Chart of year

Chart of year Seebruck / Alz
Waterlevel from 06.12.2022 to 05.12.2023
- 03.06.2013 Wasserstand: 238 cm
- 04.08.1991 Wasserstand: 205 cm
- 22.07.1981 Wasserstand: 190 cm
- 13.08.2002 Wasserstand: 188 cm
- 12.09.2007 Wasserstand: 181 cm
| Date | Mean value [cm] | Maximum [cm] | Minimum [cm] |
|---|---|---|---|
| 05.12.2023 | 94 | 95 | 93 |
| 04.12.2023 | 96 | 98 | 95 |
| 03.12.2023 | 99 | 100 | 98 |
| 02.12.2023 | 100 | 101 | 98 |
| 01.12.2023 | 97 | 98 | 96 |
| 30.11.2023 | 97 | 98 | 96 |
| 29.11.2023 | 99 | 100 | 98 |
© Bayerisches Landesamt für Umwelt 2024